Data Source Panel
Attributes
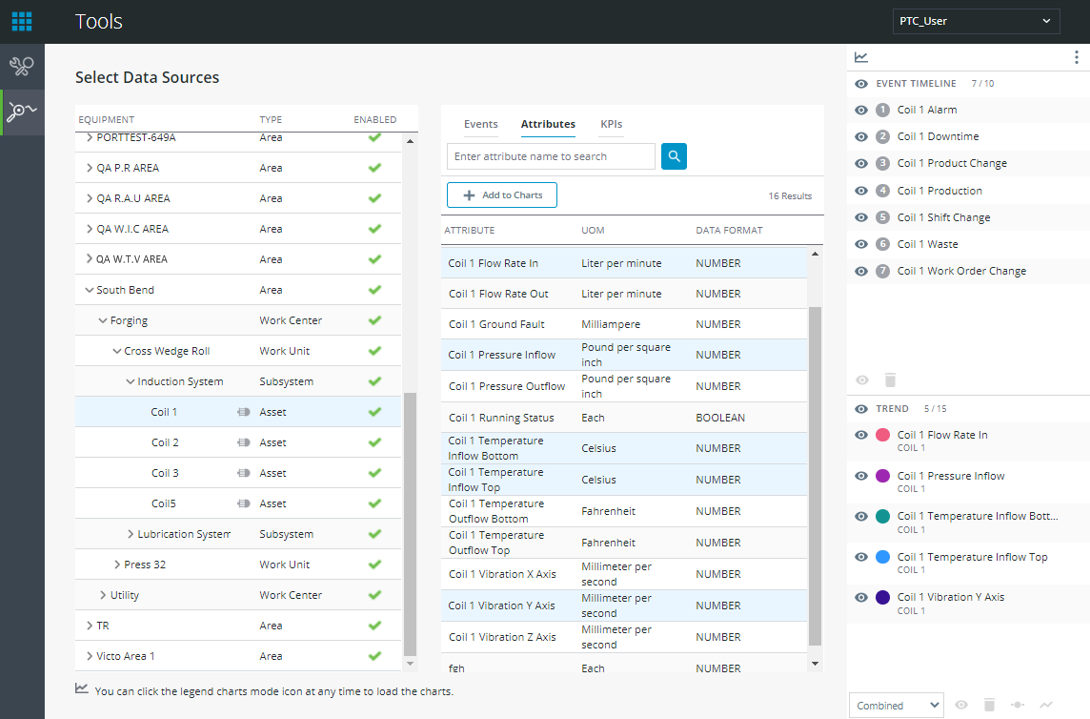
Attributes include timestamped values collected during operations, via an IoT connection, manual data entry, or calculation. They will be shown in the Charts view as a time series trend.
1. From the Select Data Sources display, locate and select the desired equipment.
2. In the middle panel, n the Attributes tab, select the event types to analyze. Shift and Control can be used to multi-select.
3. Click Add to Charts. The selected events will appear in the lower section of the legend panel to the right.
|
|
Up to 15 combined attributes and KPIs can be added to the chart. If the selected items cannot be added, a message will be displayed.
|