Data Tools
Event Timeline
General
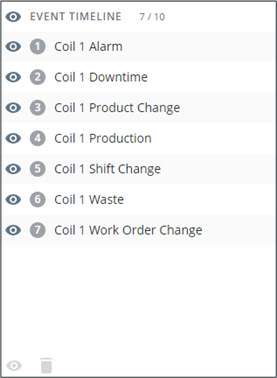
Events are listed in the top section of the legend panel. The number label corresponds with the order shown in the timeline section of the chart.
The legend tools allow you to interact with the chart in real time.
Users can select, show/hide, alias, and remove events via the legend.
The bottom toolbar is disabled until one or more events are selected. The toolbar allows you to interact with multiple events at once.
Selection
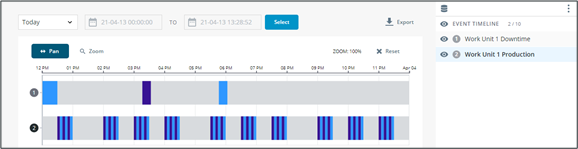
Clicking one or more events in the legend will select it in the legend as well as highlight it in the chart with a darker number label.
Show/Hide
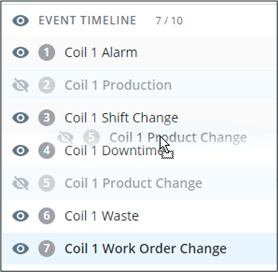
Users can hide an event by clicking  next to the item in the legend. It will then be disabled from the legend and disappear from the chart event timeline.
Display a hidden item by clicking  .
.
Select multiple events and bulk hide or show them by clicking in the bottom toolbar. The bottom toolbar is disabled when there is no item selected.
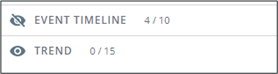
Hide the entire event timeline section by clicking in the header. Clicking again will toggle visibility back on. The two sections cannot be hidden at the same time.
Reorder
Drag and drop an event to reorder the list. The order will shuffle in the chart event timeline.
Alias
Mouse over an event in the legend, and then mouse over  to access more tools in a dropdown menu.
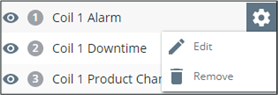
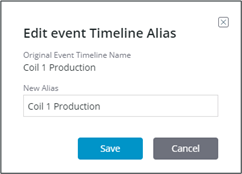
Click Edit to launch the edit event timeline alias popup.
1. Enter the new name for the event.
2. Click Save.
3. Click Cancel to abandon the change.
4. The legend will update to reflect the new name for your event.
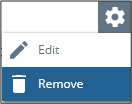
Remove
Remove an event from the chart completely from the tools submenu by clicking Remove.
Bulk remove events by selecting multiple and clicking  in the bottom toolbar.
The bottom toolbar is disabled if there is no item selected.