KPI Availability Drilldown
The Availability drilldown shows the availability for the selected asset over time.
The metrics at the top of the window show details related to availability. Any time metrics displayed here use the following convention: D HH:mm:ss. If the metric is less than a day, the time will just appear as HH:mm:ss.
Users can zoom in and out on the availability time line to view information for different time frames. The default time frame that is displayed is the time frame selected in the KPI dashboard filter.

• Regular Time is the total amount of time between two dates.
• Available Time is the time when the equipment is available to run.
• Loaded Time is the time an equipment is scheduled to run.
• MTTR (mean time to repair) is a maintenance metric that measures the average time required to troubleshoot and repair failed equipment.
• MTBF (mean time between failures) is the average time between system breakdowns.
• Process Downtime is the aggregation of all downtime on the equipment not categorized as Unavailable, Work Center Restraint, Work Unit Restraint or Plant Not Open. Additionally a downtime is considered Process Downtime when there is no reason associated to the downtime OR the reason assigned to the downtime does not have a category.
For more information on how KPI Availability Parameters are calculated see KPI Availability Parameters
The timeline chart uses the following color scheme while displaying the different status for the selected asset.

The Downtime Reasons section shows the reasons for each availability category. Select a specific availability reason in the reason tree to filter the data that is displayed in the pie chart. Click Select Top Level to return to the top-level chart view.
The pie chart shows the breakdown of the equipment availability by Reason. Users can hover over a segment in the chart to see a tooltip of detailed information for the segment.
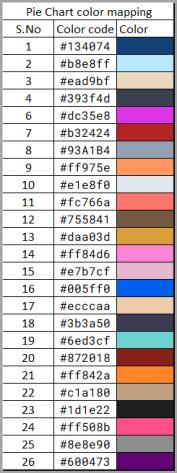
The pie chart does not have predetermined colors for individual downtimes. It displays each downtime reason associated with a color in the order as given in following image. If there are more reasons than the specified color list, the color association restarts from the beginning of the list.
|
|
For any running time in between downtimes, the pie chart will always show the running time as Green. The immediate next color in the sequence for associating to a downtime will be skipped.
|
KPI Availability Parameters
Name | Definition | Calculation |
|---|---|---|
Constraint Unit | The equipment for which downtime is considered when calculating the Work Center Availability Percent. The downtime on this equipment is used for the percentage calculation. | — |
Calendar Time | The total time between two dates without any filter. | (Interval End Time – Interval Start Time) |
Unavailable Time | Time when the equipment is not scheduled to run or is not running due to an extraordinary event. For example: holidays, company meeting, act of god. | (Downtimes having the category type Unavailable time) + (Downtimes having the category type Plant Not Open) |
Plant Not Open Time | Time during which plant is not open.In order to calculate the OOE, a distinction is made between the Unavailable Time and the Plant Not Open time. For the regular OEE calculation, The Plant Not Open time is part of the Unavailable Time but for the OOE calculation it is used to compute the schedule rate. | (Sum of all downtimes having the category Plant Not Open) |
Available Time | The time during which the equipment is available for production. This is the time remaining after the Unavailable Time is subtracted from the Calendar Time. | |
Work Center Restraint Time | Time when the equipment is down but should not be held accountable for it, such as when the line is lacking a raw material. This value will be used when calculating the Work Center Availability Percent and the Work Unit Availability Percent. | (Sum of the downtimes having the category type Work Center Restraint) |
Work Unit Restraint Time | Time when the equipment is down but should not be held accountable for it. such as when the equipment is blocked due to some downstream equipment being down. This value is used when calculating the Work Unit Availability Percent. | (Sum of the downtimes having the category type Work Unit Restraint) |
Work Center Loading Time | The time during which the equipment is available for production and should be held accountable for any downtime. This is the time remaining after the Work Center Restraint Time is subtracted from the Available Time. | |
Work Unit Loading Time | The time during which the work unit is available for production and should be held accountable for any downtime. This is the time remaining after the sum of Work Center Restraint Time and Work Unit Restraint Time is subtracted from the Available Time. | Available Time - (Work Center Restraint Time + Work Unit Restraint Time) |
Process Downtime | All other downtimes on the equipment that have not been considered as a part of the Unavailable time, Work Center Restraint Time and Work Unit Restraint Time and Plant Not Open Time . | (Sum of all other downtimes) |
Work Center Operating Time | Time during which the work center is in production. | |
Work Unit Operating Time | Time during which the work unit is in production. | |
Work Center Availability Percent | The availability of the work center as a percentage, calculated using the downtimes on the Constraint Unit for the work center. | (Work Unit Operating Time / Work Center Loading Time) * 100 |
Work Unit Availability Percent | The availability of a selected work unit, calculated using the downtimes for the selected work unit. | (Work Unit Operating Time / Work Unit Loading Time) * 100 |
Mean Time To Repair (MTTR) | Mean time to repair (MTTR) is a maintenance metric that measures the average time required to troubleshoot and repair failed equipment. It reflects how quickly an organization can respond to unplanned breakdowns and repair them. MTTR calculations will exclude all downtimes that are not process downtimes (Plant Not Open, Planned Downtimes, Work Unit Constraint, Line Constraint). | (Total Maintenance Time / Total Number Of Repairs) |
Mean Time Between Failures (MTBF) | Mean time between failures (MTBF) is the average time between system breakdowns. | (Total Operational Time / Total Number Of Failures) |