Configuring Data Logging for RAC
One of the first steps that you can perform when troubleshooting connection issues is to review the RAC logs. You can configure RAC to display more detailed logs when troubleshooting issues in one of the following ways:
• Using the RAC user interface.
• By creating a log4js.json file.
Using the RAC User Interface
1. In the RAC, click  , then Logging Settings.... The Logging Level dialog opens.
, then Logging Settings.... The Logging Level dialog opens.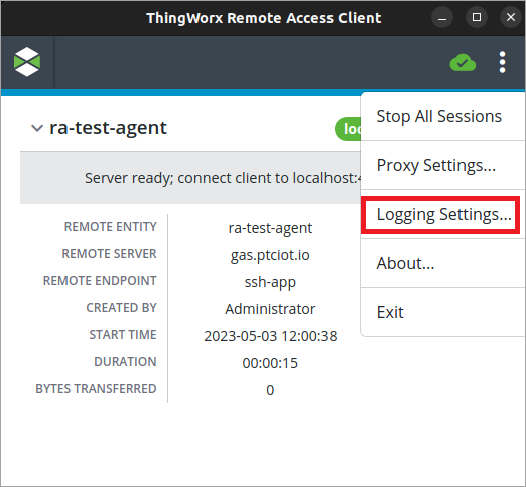
2. Under Logging Level, select the logging level that you want to set for RAC sessions. You can select INFO (default), DEBUG, TRACE, WARN, or ERROR.
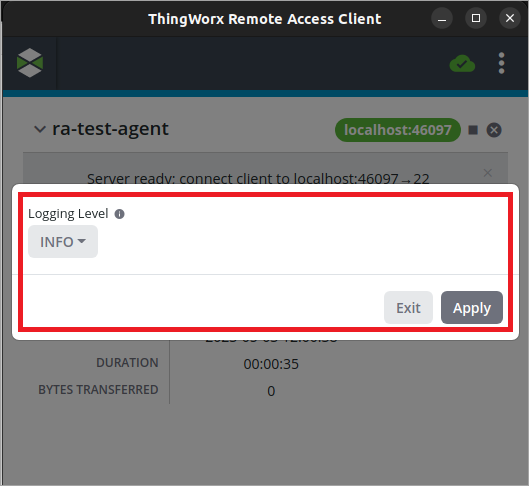
3. Click Apply.
The RAC log file now displays logs based on the configured level when starting remote sessions.
|
|
• Changes to this setting are not saved when RAC is closed.
• When DEBUG logging is applied, the IP address and port numbers of remote connections are displayed in the tw-ra-client.log file.
|
Creating a log4js.json file
1. Create a log4js.json file in the following locations, based on the operating system of the RAC user:
◦ Windows—%AppData%/tw-ra-client/log4js.json
◦ Mac OS—~/Library/Application Support/tw-ra-client/log4js.json
◦ Linux—.$HOME/.config/tw-ra-client/log4js.json
2. Open the file in a text editor, then add the following JSON:
{
  "appenders": {
    "out": {
      "type": "stdout"
    },
    "outFilter": {
      "type": "logLevelFilter",
      "appender": "out",
      "level": "info"
    },
    "logFile": {
      "type": "file",
      "filename": "<path_to_file>/tw-ra-client/tw-ra-client.log",
      "level": "debug",
      "maxLogSize": 10485760,
      "backups": 5,
      "keepFileExt": true
    }
  },
  "categories": {
    "default": {
      "appenders": [
        "outFilter",
        "logFile"
      ],
      "level": "debug"
    }
  }
}
3. In the filename property, specify the location of the tw-ra-client.log file.
|
|
On Windows, the full path to the file is required. You can include a relative path to the file on Mac OS and Linux. However, we recommend adding the full path.
|
4. Optionally, to include trace logs, change the level property from debug to trace.
|
|
Saving trace logs can increase the size of the log file significantly.
|
5. Save the file.
The RAC log file now displays additional logs when starting remote sessions.
Example log4js.json File on Windows
{
  "appenders": {
    "out": {
      "type": "stdout"
    },
    "outFilter": {
      "type": "logLevelFilter",
      "appender": "out",
      "level": "info"
    },
    "logFile": {
      "type": "file",
      "filename": "C:/Users/racuser/AppData/Roaming/tw-ra-client/tw-ra-client.log",
      "level": "debug",
      "maxLogSize": 10485760,
      "backups": 5,
      "keepFileExt": true
    }
  },
  "categories": {
    "default": {
      "appenders": [
        "outFilter",
        "logFile"
      ],
      "level": "debug"
    }
  }
}