Example 2: Few Things, Few Properties, and High Write Frequency
Scenario
High-Level Scenario Overview for Example 2
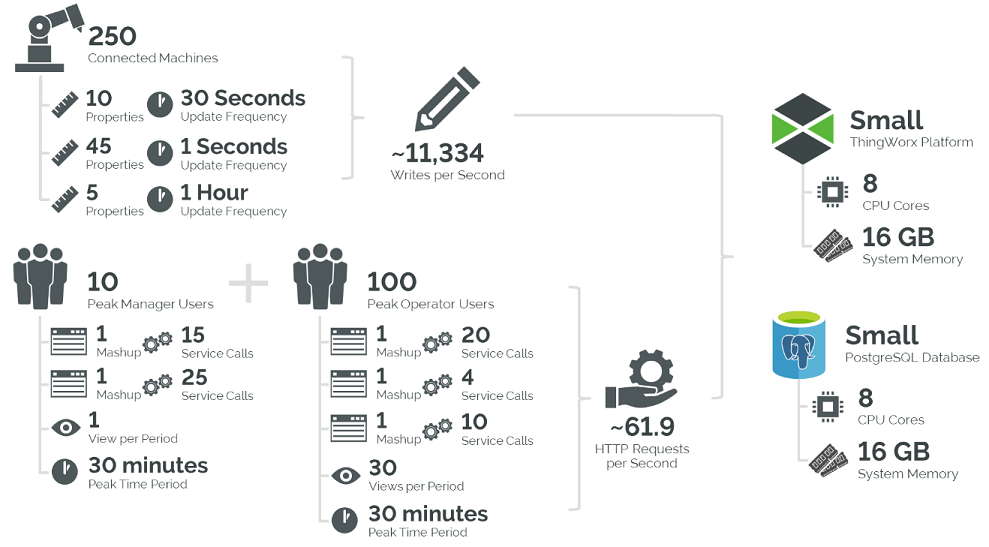
A medium-sized factory where 250 monitored machines each send 60 property updates to ThingWorx at varying rates (see requirements).
The peak usage period is 30 minutes long, at which time 100 users may make varying numbers of calls to 5 unique mashups, each with varying numbers of services. This configuration uses a PostgreSQL database.
Requirements
• Number of Things (T): 250 things
• Number of Properties (P, three different property groups on each device):
P1 | P2 | P3 |
|---|---|---|
10 properties | 45 properties | 5 properties |
• Write Frequency (F):
F1 | F2 | F3 |
|---|---|---|
every 30 seconds (2,880 per day) | every second (86,400 per day) | every hour (24 per day) |
• Peak Usage Period (t) = 30 minutes, or 1800 seconds
• Number of Mashups (M) = 5 mashups
• Number of Users (UM):
UM1 | UM2 | UM3 | UM4 | UM5 |
|---|---|---|---|---|
100 users | 100 users | 100 users | 10 users | 10 users |
Note: Mashups with a smaller number of user requests are common for administrative users | ||||
• Number of Services Per Mashup (SM):
SM1 | SM2 | SM3 | SM4 | SM5 |
|---|---|---|---|---|
20 services | 4 services | 10 services | 15 services | 25 services |
• Number of Times Users Load Each Mashup (LM):
LM1 | LM2 | LM3 | LM4 | LM5 |
|---|---|---|---|---|
30 times | 30 times | 30 times | 1 time | 1 time |
Note: 30 times indicates mashups 1, 2, and 3 are reloaded every minute during the 30 min peak period, likely by an auto-refresh. | ||||
Calculations
• Data Ingestion:
WPS = T × [(P1 × F1) + (P2 × F2) + (P3 × F3)]
= 250× [(10 × 1/30) + (45 × 1) + (5 × 1/3600)]
≈ 11,334 writes per second
= 250× [(10 × 1/30) + (45 × 1) + (5 × 1/3600)]
≈ 11,334 writes per second
This is a bit more complex as there are properties writing at different rates. Remember you can divide FD by 86,400 to convert it to seconds if needed.
Do not forget to calculate the CS value as well:
CS = T / 100,000
= 250/ 100,000
= 0.0025 Connection Servers
= 250/ 100,000
= 0.0025 Connection Servers
• Data Visualization:
R = [(SM + 1) × UM × LM ] / t
R1 = [(20 + 1) × 100 × 30 ] / 1800
≈ 35 requests per second
R2 = [(4 + 1) × 100 × 30 ] / 1800
≈ 8.33 requests per second
R3 = [(10 + 1) × 100 × 30 ] / 1800
≈ 18.33 requests per second
R4 = [(15 + 1) × 10 × 1 ] / 1800
≈ 0.09 requests per second
R5 = [(25 + 1) × 10 × 1 ] / 1800
≈ 0.14 requests per second
R = R1 + R2 + R3 + R4 + R5
≈ 61.89 requests per second
In this scenario, each mashup has different numbers of services, while some are called by a smaller count of users. In addition, some refresh every minute, while others may only be loaded once.
In this situation, make sure not to overlook LM. The additional service calls for a mashup with automatic refresh can have a significant impact on system sizing.
While this calculation has more parts, breaking down the equation for each mashup and adding the results (illustrated above) is straightforward.
Criteria Comparison
• T = 250 -> “Extra-Small” Platform (or larger, with PostgreSQL)
• CS = 0.0025 -> No Connection Servers are required
• WPS = 11,334 -> “Small” Platform size (or larger)
• R = 61.89 -> “Medium” Platform size (or larger)
Sizing
Given that a “Medium” ThingWorx system is needed to satisfy all criteria, the following sizing should be considered, based on hosting type:
Size | Azure VM | AWS EC2 | CPU Cores | Memory (GiB) |
|---|---|---|---|---|
ThingWorx Platform: Medium | F16s v2 | C5d.4xlarge | 16 | 32 |
PostgreSQL DB: Medium | F16s v2 | C5d.4xlarge | 16 | 32 |
Comparing Calculated and Observed Results
For Example 2, the simulation mimics an actual application with multiple mashups making various service calls each at different refresh rates, along with simulated remote Things sending data to the platform at varied rates.
From an infrastructure perspective the platform performed well, averaging 34.8% CPU usage and 3.1 GB memory consumption. PostgreSQL averaged 35.1% CPU usage and 8.1 GB of memory.
From a platform perspective, the HTTP request rate averaged 63 operations per second – in line with the expected 62 OPS, and the Value Stream Queue writes per second was stable around 12k WPS in practice - close to the expected 11.3k WPS above.
Observed Results from Simulated Deployment of Example 2
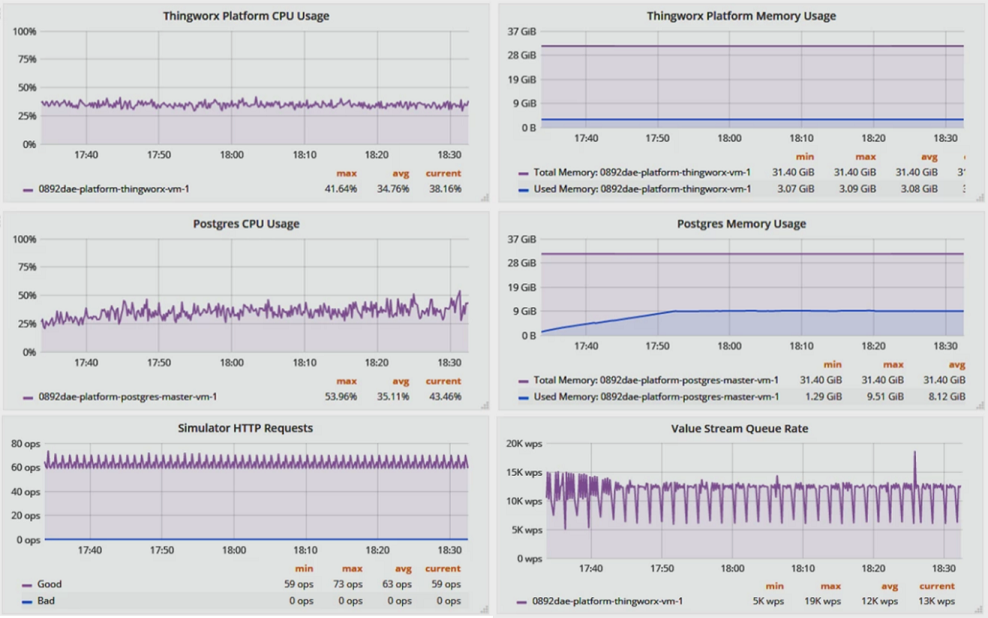
From an application or user perspective, no errors, performance issues, or bad request/responses were observed by the device or user simulators. All new requests were processed in a timely fashion.
As illustrated in the charts above, the implementation has enough resources to spare for both a simulated, steady-state workload as well as more real-world spikes in device and/or user activity.