Example 1: Many Things, Few Properties, and Low Write Frequency
Scenario
High-Level Scenario Overview for Example 1

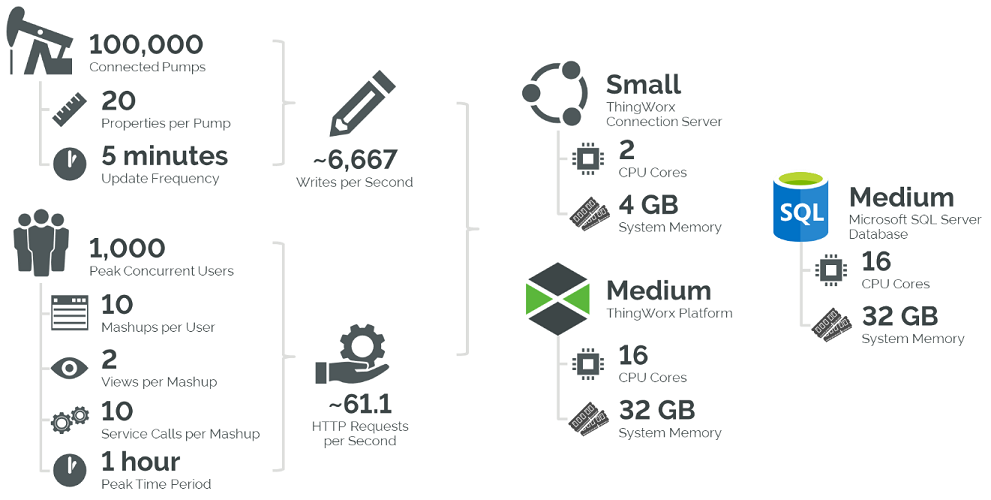
Monitoring 100,000 pumps throughout the area. Each pump reports 20 property values to ThingWorx every five minutes. During peak user access, 10 mashups, each with 10 services, will be called by 1,000 users in one hour. This ThingWorx configuration use a Microsoft SQL Server database.
Requirements
• Number of Things (T): 100,000 things
• Number of Properties (P): 20 properties
• Write Frequency (FD): every 5 minutes, or 288 writes per day
• Peak Usage Period (t): 1 hour, or 3600 seconds
• Number of Mashups (M): 10 mashups
• Number of Users (U): 1000 users
• Number of Services Per Mashup (SM): 10 services
• Number of Times Users Load Each Mashup (LM): 2 times
Calculations
• Data Ingestion:
WPS = T × [(P1 × F1)]
= 100,000 × [(20 × 288/86400)]
≈ 6,667 writes per second
= 100,000 × [(20 × 288/86400)]
≈ 6,667 writes per second
In this calculation, a sum is not required, as all 20 device properties have the same write frequency. |
Let’s not forget to calculate the Connection Server value as well:
CS = T / 100,000
= 100,000 / 100,000
= 1 Connection Server
= 100,000 / 100,000
= 1 Connection Server
• Data Visualization:
R = [(SM + 1) × UM × LM ] / t
= [(10 + 1) × 1000 × 2 ] / 3600
≈ 6.11 requests per second
= [(10 + 1) × 1000 × 2 ] / 3600
≈ 6.11 requests per second
To resolve the sum here, we can simply multiply the HTTP requests for all users per mashup (given by (SM + 1) x UM) by the total number of mashups (M), because every mashup is expecting the same amount of traffic and is assumed to contain the same number of services. Therefore:
R = R1 × M
≈ 6.11 × 10 ≈ 61.1 HTTP Requests per second
≈ 6.11 × 10 ≈ 61.1 HTTP Requests per second
Criteria Comparison
• T = 100,000 -> “Medium” Platform (or larger, with Microsoft SQL Server)
• CS = 1 -> One Connection Server recommended
• WPS = 6,667 -> “Small” Platform (or larger)
• R = 61 -> “Medium” Platform (or larger)
Sizing
Given that a “Medium” ThingWorx system is needed to satisfy all criteria, the following sizing should be considered, based on hosting type):
Size | Azure VM | AWS EC2 | CPU Cores | Memory (GiB) |
|---|---|---|---|---|
ThingWorx Platform: Medium | F16s v2 | C5d.4xlarge | 16 | 32 |
Microsoft SQL Server DB: Medium | F16s v2 | C5d.4xlarge | 16 | 32 |
ThingWorx Connection Server | F2s v2 | C5d.large | 2 | 4 |
Remember to review the Connection Services Help Center for Connection Server sizing, which also uses T from this guide, but also considers factors such as edge requests (including WebSockets), property updates, file transfers, and average message size.
Comparing Calculated and Observed Results
Example 1 simulates a Connected Products Solution use case, with less focus on diverse mashups and more focus on the number of Things connected to the platform. In a real-world scenario, there would be greater variations in both the number of services per mashup and the number of users accessing each mashup (as explored by Example 2).
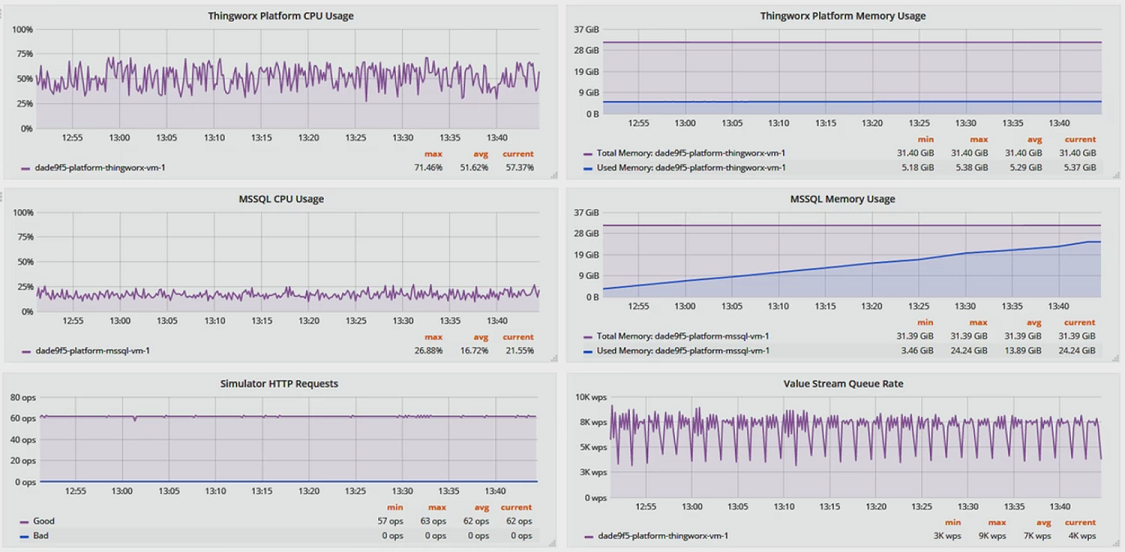
From an infrastructure perspective, the platform performed well, averaging 51.6% CPU usage and 5.3 GB memory consumption. MS SQL averaged 16.7% CPU usage and 13.9 GB of memory.
From a platform perspective, the HTTP request rate averaged 62 operations per second – in line with the expected 61 OPS, and Value Stream Queue rate was stable around 7k WPS in practice - close to the expected 6.7k WPS above.

In normal operation, SQL Server generally looks to utilize as much memory as it possibly can. It assumes it is on a dedicated machine, and stores as much data in memory as possible. This can be seen in the memory usage chart above, with consumption leveling off only near the end of the test, with a small pool left for the operating system.
While this infrastructure is stable for the duration of the sizing tests performed against it, a longer duration test – ideally until the database has reached its expected data retention levels – would be advisable before using in a production setting to ensure that the database server is sized properly.