Data Visualization
System requirements for visualization focus on server load generated from user experiences (mashups) within the business application.
Much like ingestion, the load from visualization depends not only on the number of mashups, but also the complexity of each mashup and the number of concurrent users expected to access them.
|
t
|
Time Period of Peak User Access: The length of time when the following mashups and services are called (in seconds).
|
|
M
|
Unique Mashups: The number of unique mashups expected to be accessed by users during that time.
|
|
SM
|
Services per Mashup: For each unique mashup, determine the number of services called.
|
|
UM
|
Number of Concurrent Users: The total number of users expected to use these mashups at the same time during this time period.
|
|
LM
|
Number of Times Users Load each Mashup: The number of times each individual user is expected to access that mashup in the time period.
In general, this will always be at least one, but pay special attention to mashups where auto-refresh is turned on.
|
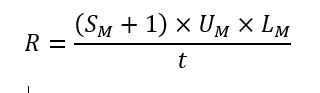
With these values, the total HTTP requests per second (R)can be determined as the sum of mashup service calls (plus one for the mashup itself) requested by each user during that time period:
For example, there are 3 unique mashups (M) in the application, with the following parameters:
• The time of peak user access is one hour long (t = 3,600 seconds)
• Two of the mashups make 10 service calls each (both S1 and S2 = 10)
• The third mashup makes 20 service calls (S3 = 20)
• The first mashup will be accessed by 1,000 users each hour (U1 = 1000)
• The other two mashups will be accessed by 100 users each hour (both U2 and U3 = 100)
• None of the mashups will have automatic or manual refreshes beyond this, describing a scenario where end users consume the provided information once a piece in the allotted timeframe (of one hour)
(L1, L2 and L3 = 1)
The calculation would be:
R = [(SM + 1) × UM × LM ] / t
R1 = [(S1 + 1) × U1 × L1] / t
= [(10 + 1) × 1000 × 1] / 3600
≈ 3.06 requests per second
= [(10 + 1) × 1000 × 1] / 3600
≈ 3.06 requests per second
R2 = [(S2 + 1) × U2 × L2] / t
= [(10 + 1) × 100 × 1] / 3600
≈ 0.31 requests per second
= [(10 + 1) × 100 × 1] / 3600
≈ 0.31 requests per second
R3 = [(S3 + 1) × U3 × L3] / t
= [(20 + 1) × 100 × 1] / 3600
≈ 0.61 requests per second
= [(20 + 1) × 100 × 1] / 3600
≈ 0.61 requests per second
R = R1 + R2 + R3
≈ 3.06 + 0.31 + 0.61
≈ 3.98 requests per second
≈ 3.06 + 0.31 + 0.61
≈ 3.98 requests per second
Again, in this scenario an extra-small ThingWorx system with a simple database such as H2 should handle this load but is not recommended for production use.
Most calculations will be more complex, likely with more unique mashups, each with more services calls and concurrent users than given here.
Two examples involving these calculations are provided here.