Using the Time Series Chart in Runtime
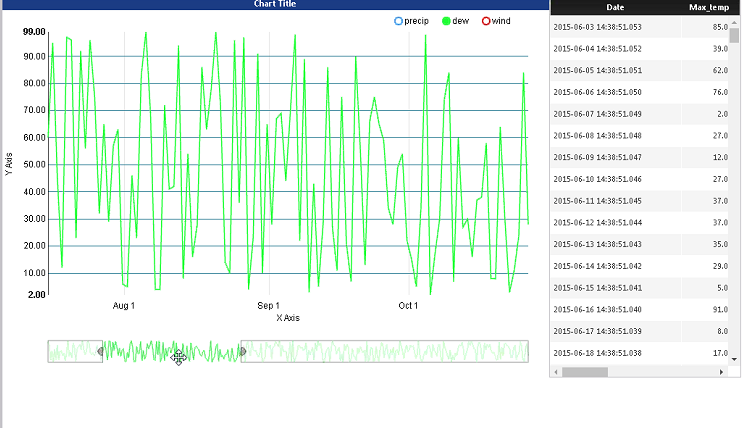
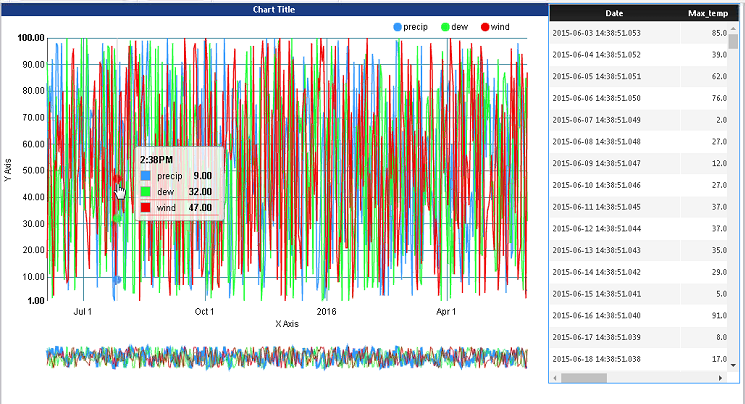
The time series chart supports interactivity at run time. The legend can be used to view the data in different ways. The example time series chart below contains three data series. Note the following run time behaviors:
• To turn a data series on or off, click the series name in the legend.
• To view a single data series, double-click it in the legend.
In the chart below, the “dew” series is displayed.
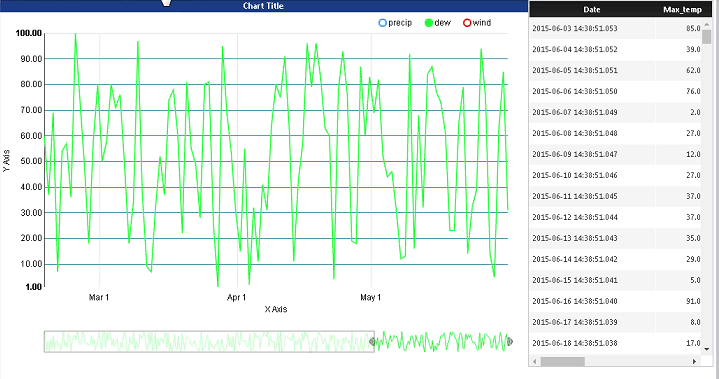
Zoom Strip
The time series chart includes responsive zoom strip functionality, which allows you to zoom in on a portion of the chart. This allows you to view details in specific portions of the series.
The zoom strip is only available in a static layout |
Using the Zoom Strip on single data series
To view a single series of data, click the property in the legend. In the example below, the “dew” property is selected.
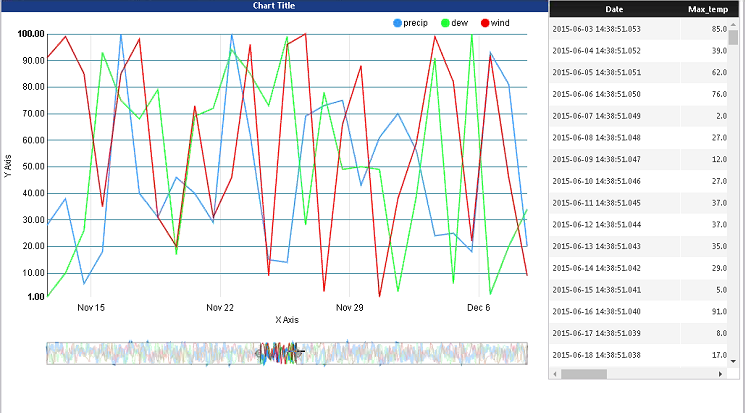
Using the Zoom Strip on single data series
To view a single series of data, click the property in the legend. In the example below, the “dew” property is selected.