Time Series Chart Widget Extension
Dependencies
• If you are using pre-7.2 versions of the D3 Tree and/or D3 Network extensions, you must upgrade to the latest version(s) before using the Time Series Chart extension. This is because updates to the d3v2 library that are also included in the Time Series Chart widget extension.
• The Time Series Chart widget extension uses NVD3 and D3 third-party libraries. These two libraries are dependent on each other and the D3 version 3.5.X is mandatory for the Time Series Chart to function properly in the Platform. So, it is mandatory for any other ThingWorx extension that needs to work with Time Series Chart to have a D3 library with the version 3.5.X. If the extension has any other D3 version, Time Series Chart cannot be used.
|
|
NVD3 is compatible with D3 version 3.5.3 and higher, but not with D3 version 4.X yet.
|
Introducing the Time Series Chart Widget Extension
PTC recommends replacing the Time Series Chart Widget Extension with the standard Line Chart widget. The standard widget supports theming, multiple data series, grouping, and additional features. |
Key enhancements include:
• Faster loading, drawing, and resizing than built-in time series
• Improved rendering and anti-aliasing
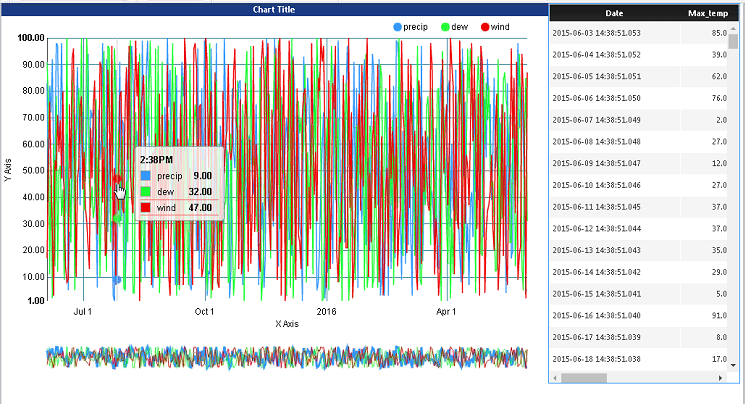
The time series chart is designed for use with infotable data where the x axis represents time. It will support up to 2000 data points across up to 8 series updated at a rate of up to 6 times per minute.
Zoom Strip
The time series chart includes responsive zoom strip functionality, which allows you to zoom in on a portion of the chart. This allows you to view details in specific portions of the series.
The zoom strip is only available in a static layout. |