Using VisualVM to Monitor Memory Issues
When VisualVM is connected to your ThingWorx solution, you can retrieve real-time data that shows the memory, CPU, and thread usage in your solution. VisualVM is used to identify common memory issues and to further drill-down into the root cause of the behavior.
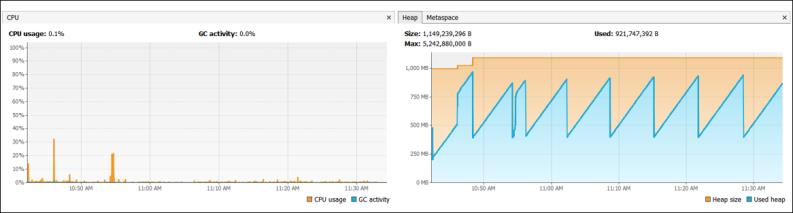
When your ThingWorx solution is in a good state, VisualVM shows steady memory and CPU usage over time. The used memory graph shows regular series of peaks. This is because JVM uses the available memory before performing a cleanup. The GC activity is a negligible percentage (less than 5%) of the total CPU usage.
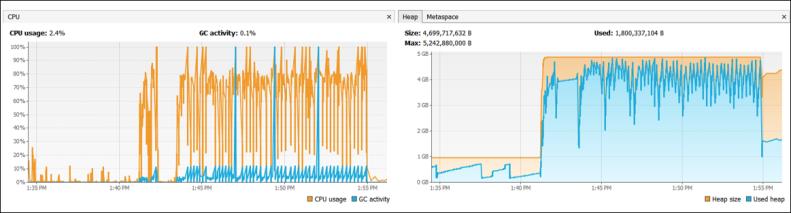
When the system requires more resources, the used memory levels remain elevated for long periods of time. There is a constant or sometimes extremely high GC activity as a percentage of total CPU usage.
The graphical indications of memory exhaustion are similar to the memory metrics of other tools, such as the GC log. When you use VisualVM, you do not get a specific metric at the JVM level. It only gives a visual indication of the problem. To identify the root cause of the issue, you should analyze the problem in detail.
When you see memory issues in VisualVM, measure which threads are using the memory the most. Check this in the > > option.
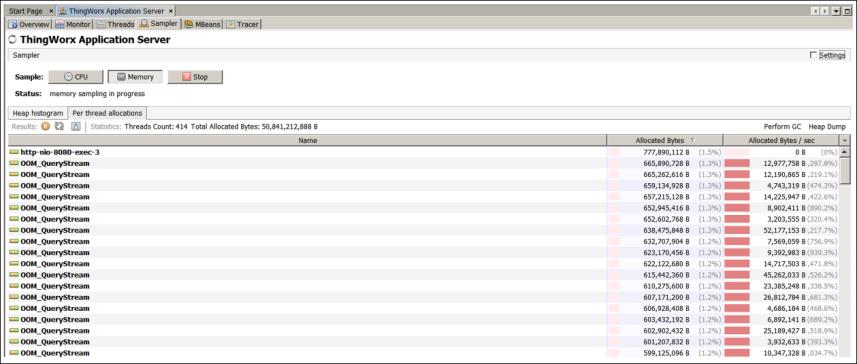
The sampling data in a production environment has additional performance impact and can cause a slow solution to become entirely unresponsive. In production environments, use the sampler as the last alternative to obtain diagnostic data. |
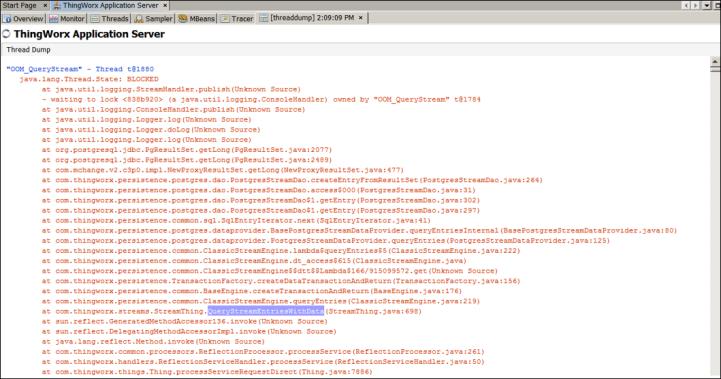
When you enable the sampler option in VisualVM, you can check which threads use the most memory in your ThingWorx solution. To see what these threads are doing, stop the sampler, collect the thread dump from the Threads tab, and search the result for the top thread names. For example, in the preceding image, the OOM_QueryStream threads perform the QueryStreamEntriesWithData lookup, which are known to trigger memory issues in ThingWorx solutions depending on how this service is called.
When there is a problem, you can collect a snapshot of the solution. The snapshot captures all the graphs and thread dumps. This data can be provided to PTC Support for additional analysis of the issue. Collecting a snapshot does not impact the performance of the solution.
VisualVM also allows you to perform GC operations manually and collect heap dumps. These operations should not be performed unless advised by PTC Support.
Recommendation—In case of periods of slow performance, it is recommended to inspect the memory graphs in VisualVM and sample the memory to identify periods of high usage.