Time Tracking for End Users
You can build various Salesforce reports on the IB Time Card object to monitor the time lapsed between different events. The event example can be servicing or any activities on the installed products.
Reports on IB Events
Two out-of-the-box Salesforce reports are available to view the downtime trend and monthly service time for different events for IBs. They are:
• IB Downtime Trend
• IB Monthly Service Time
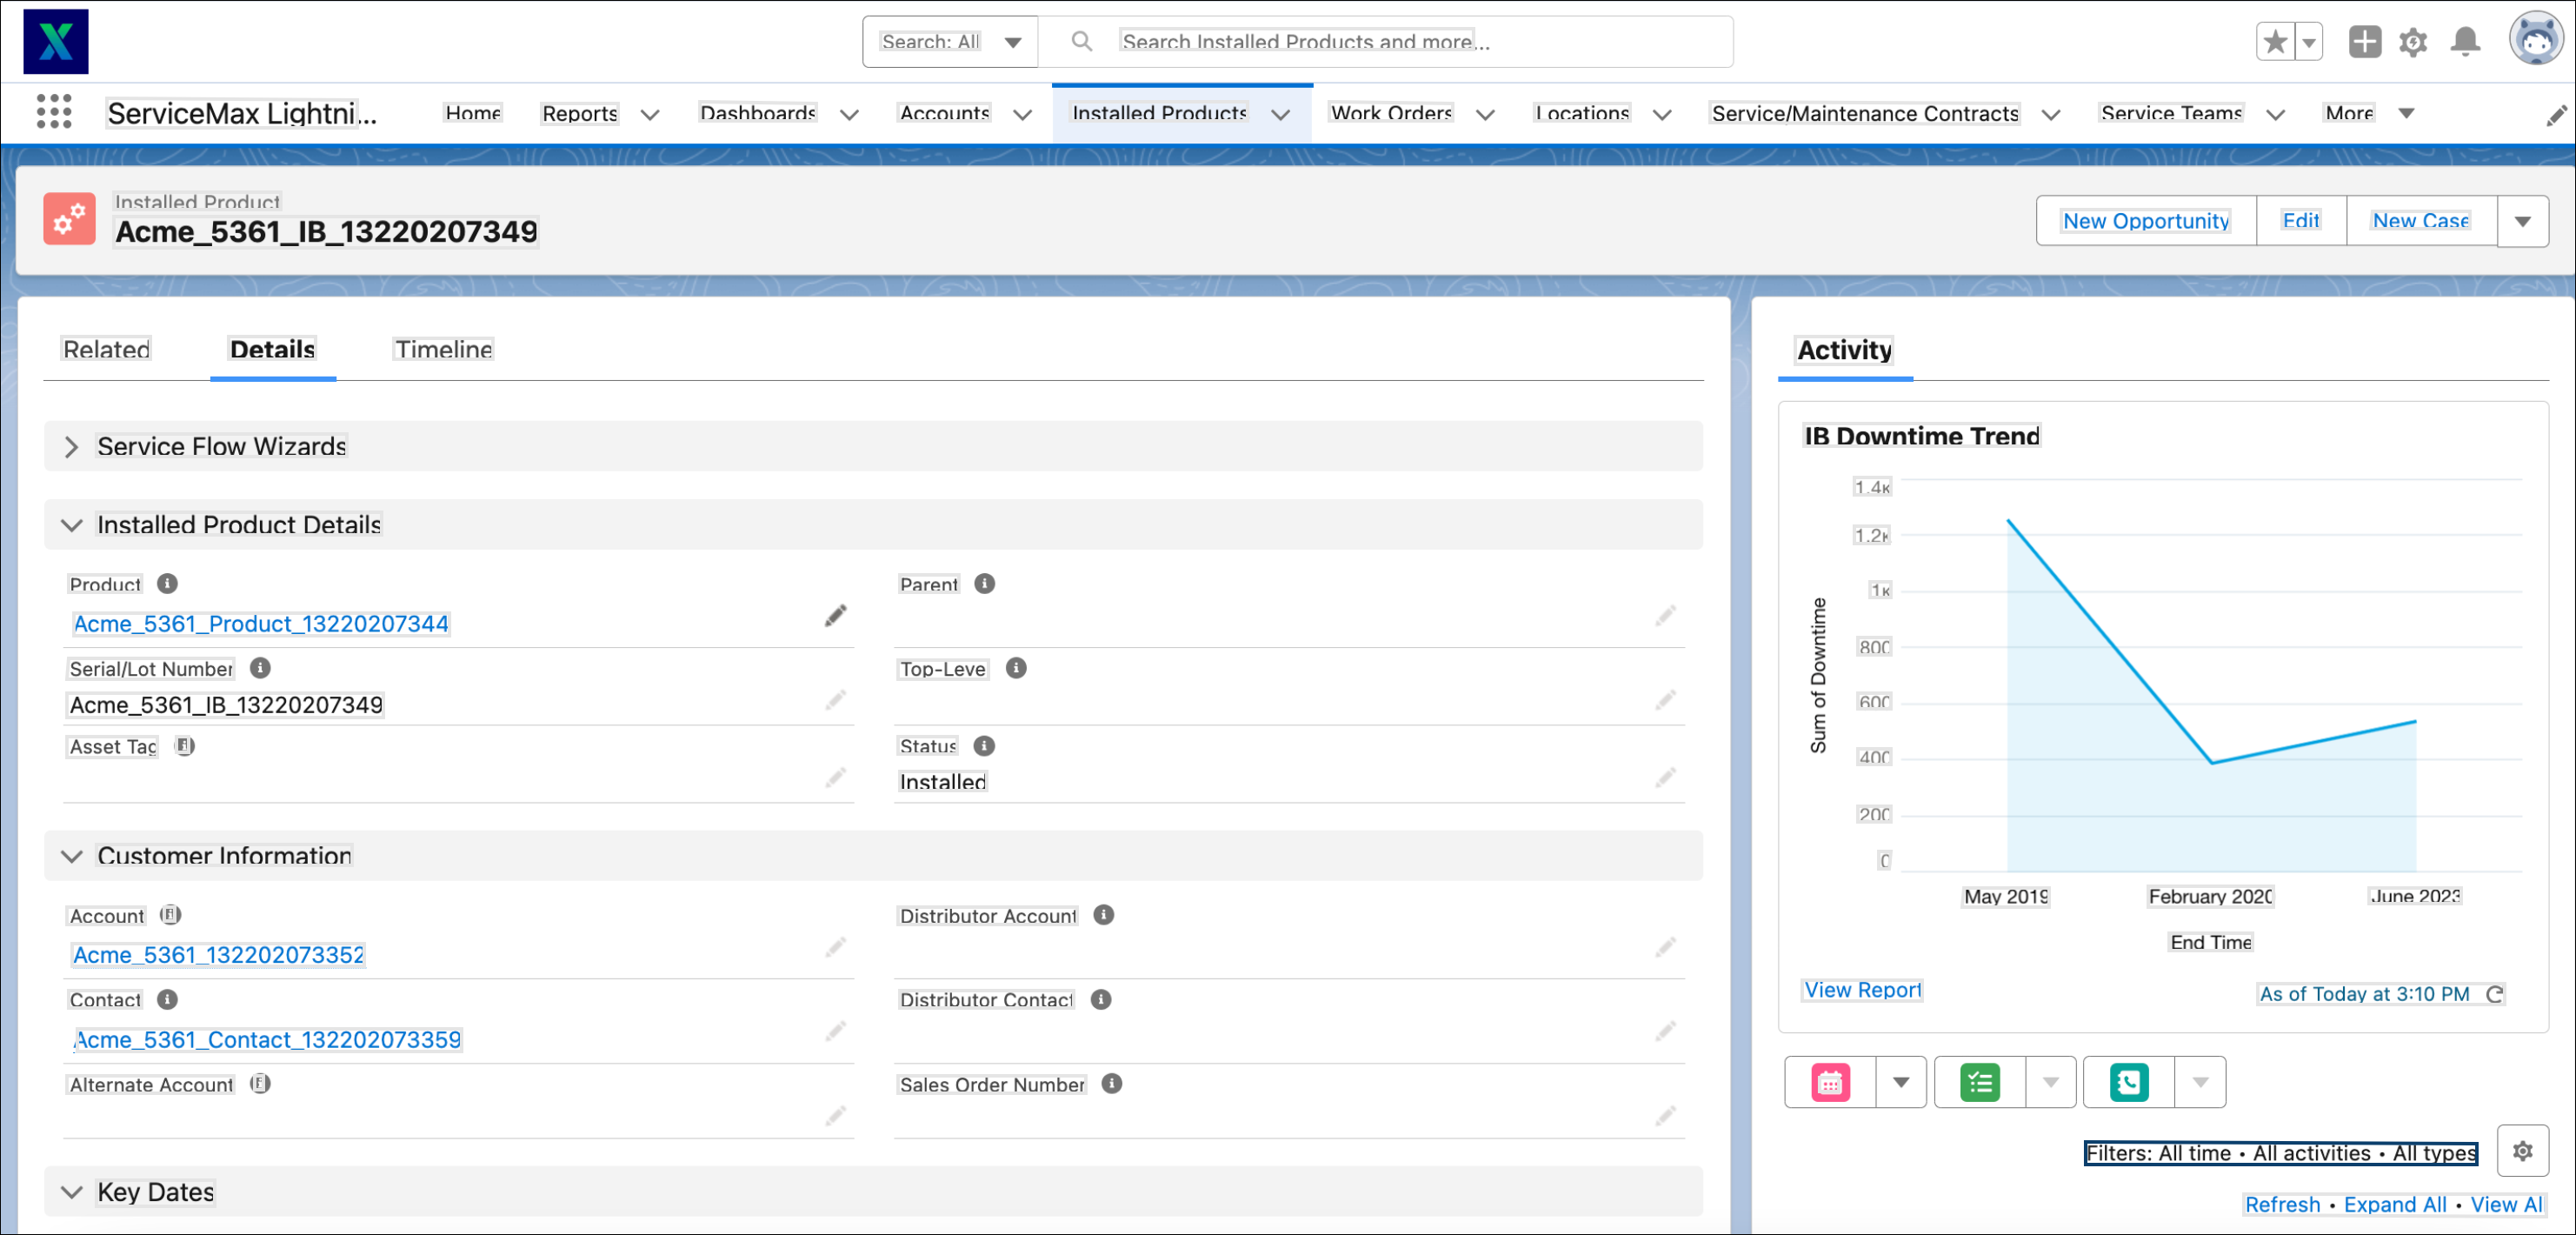
You can view the reports from the Reports tab > All Folders > IB Time Card. You can add the IB Downtime Trend report to the record page of the installed product to view the downtime trend of that specific installed product in real time.
To view the IB reports:
1. Edit an Installed product record page in Lightning.
2. Drag and drop the standard component Report Chart on the record page layout.
3. Set the component properties as follows:
◦ Report: IB Downtime Trend
◦ Filter: Installed Product: ID
4. Click Save. The downtime trend for the installed product record is displayed on loading the page.
The following screen displays the IB Downtime Trend report.
You can build your own report to view different event trends by selecting the time fields that hold the time difference in the IB time Card object.
Reference Topics
To configure a time tracking configuration for each event, see Time Tracking for Administrators.