Attribute Trend View
The Attribute Trend allows the user to visualize how installed product(s) are trending for specific attributes. This view helps users plan for corrective or preventive action based on the attribute trend.
To view the chart:
1. Follow the steps to view attribute history
2. Click chart
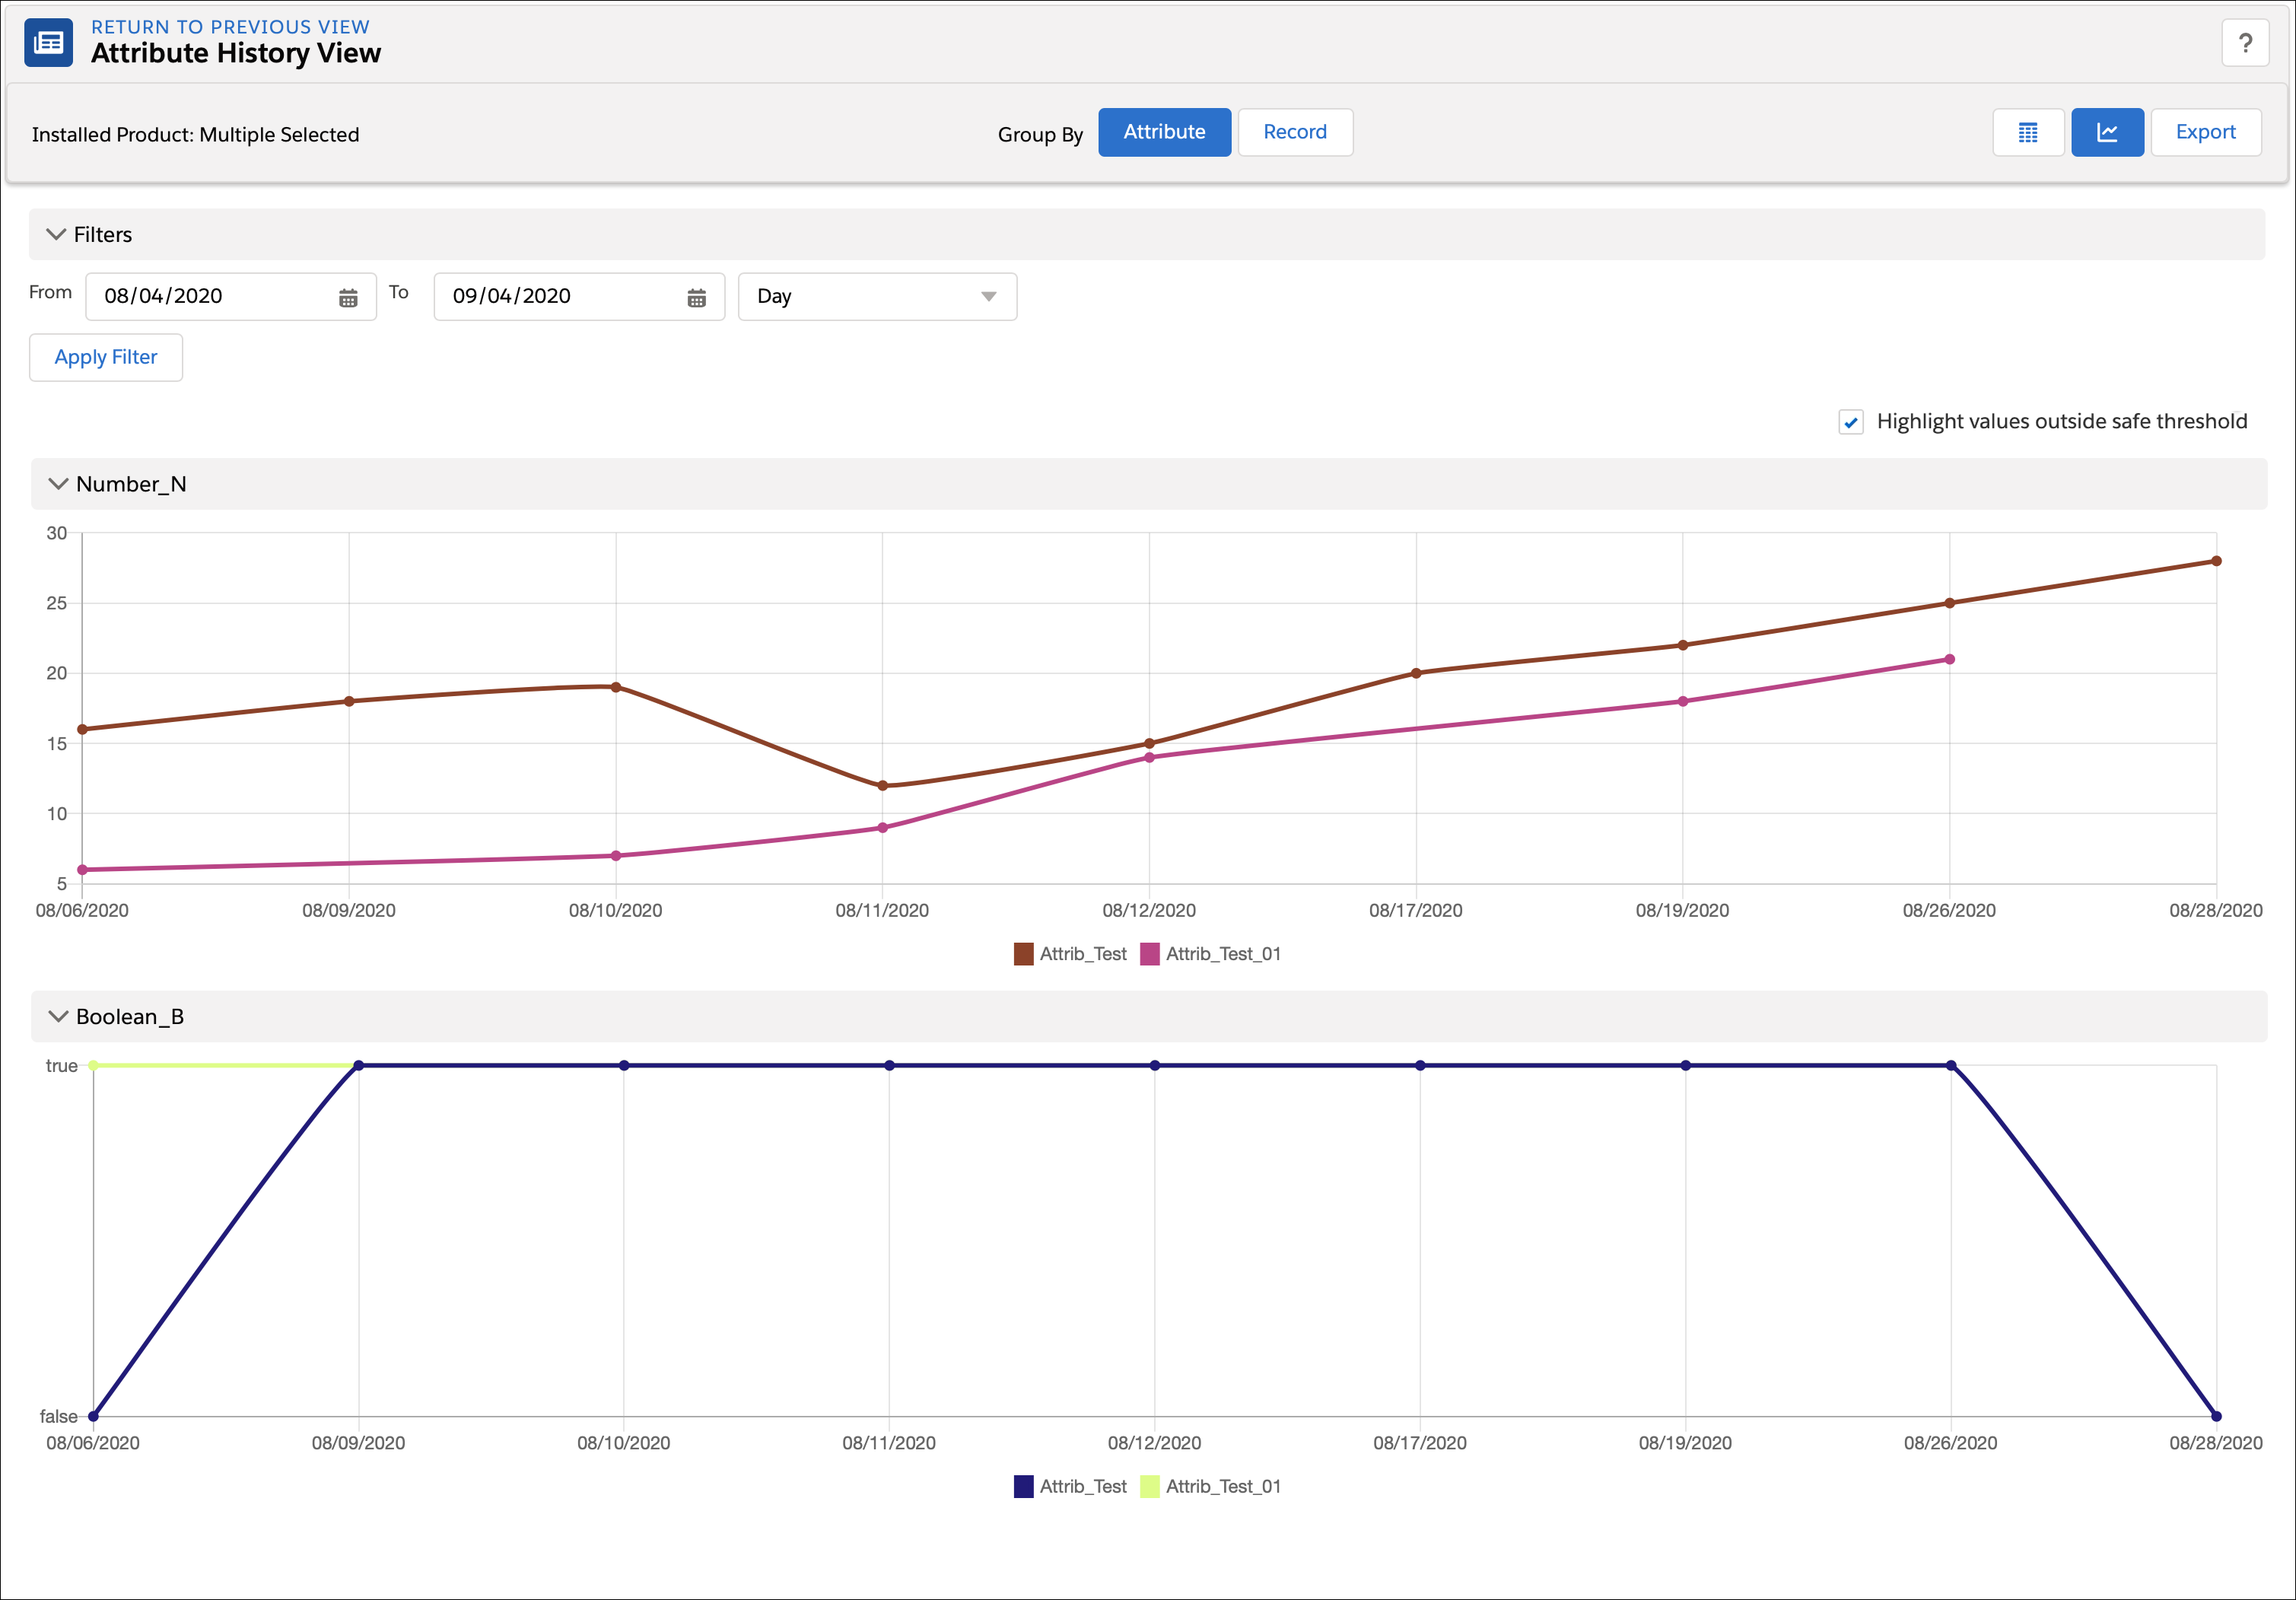
• The chart displays attribute history for all installed products grouped by Attribute, one chart per Attribute.
• You have the option to select or to deselect installed products from the chart display.
• The chart supports all attribute types.
• The chart is plotted for results displayed in the Attribute History View.
• Use the date range filter to adjust the display range.
|
|
To filter the date range for the chart, see Date Range Filter.
|