Viewing Historical Values for the Technical Attribute in Chart Format
You can view historical values for the attribute of type Number in the chart format and update the value.
To view the historical values in chart format:
1. Click the name link of the Number type attribute you want to view or update in the Technical Attributes view.
The technical attribute is displayed in a modal window.
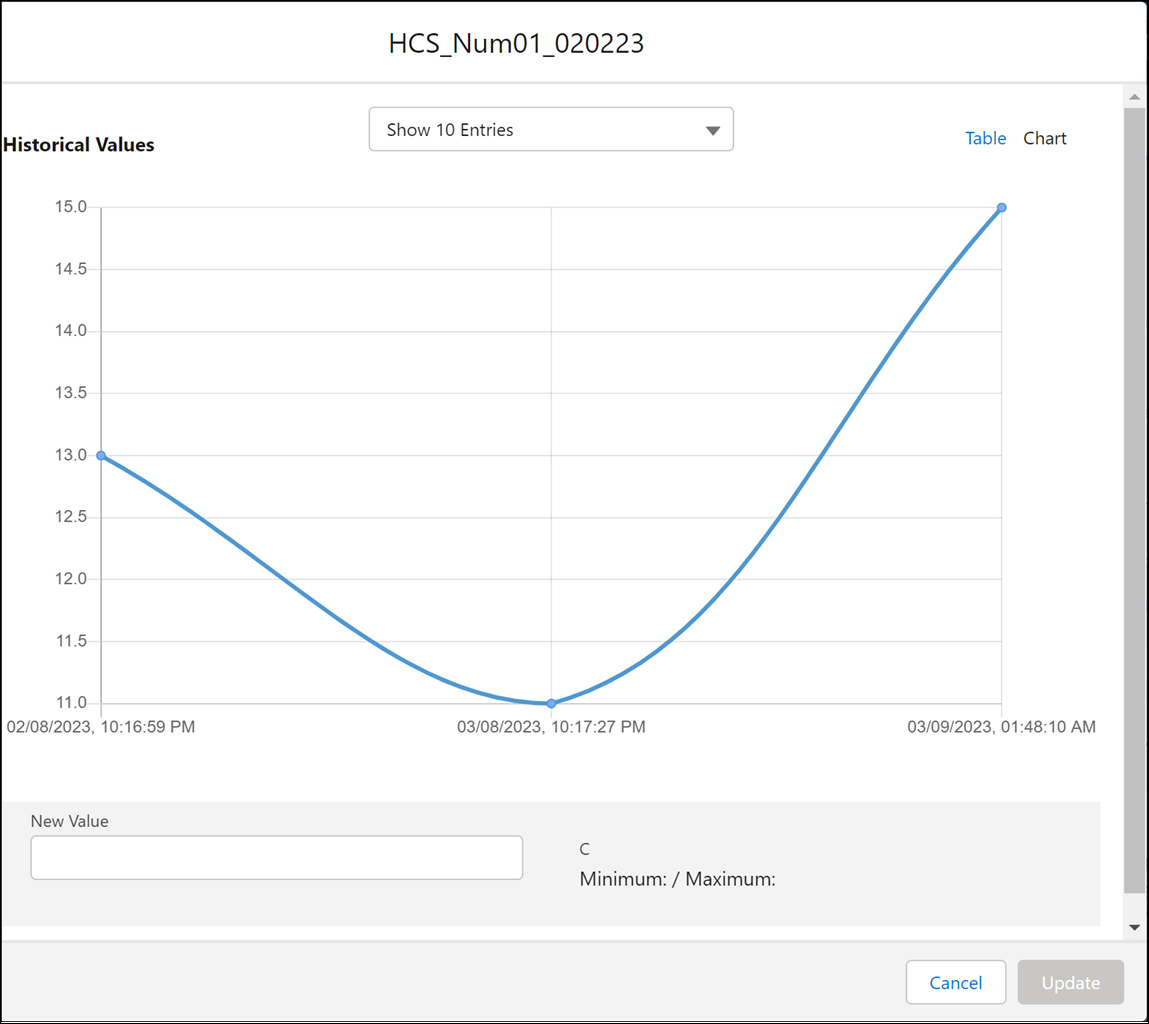
2. Click Chart.
The historical values for the attribute are displayed in a chart format.
|
|
• The chart option is available for technical attributes of type Number only.
• The values are displayed in the chart in ascending order. The earliest entry is displayed first in the chart and then it progresses to the latest entries.
|
In this window, you can also add the technical attribute value.
|
|
You can update the technical attribute value only if the administrator has enabled the option when adding the Technical Attributes component to the asset object. You cannot update the value in the New Value field if the Do not allow attribute update checkbox is selected when adding the Technical Attributes component.
|
To add the value:
1. Add the value in the New Value field.
2. Click Update.