Actions and Interactions on the Asset Timeline
You can view the following information in the Timeline area. You can also perform some interactions and access more information about the asset.
|
Timeline Item
|
Description
|
Notes
|
|---|---|---|
|
Record preview
|
Click on any event on the timeline to view more information about it. This information is obtained from the compact layout configured on the record. The following GIF displays the record preview feature. 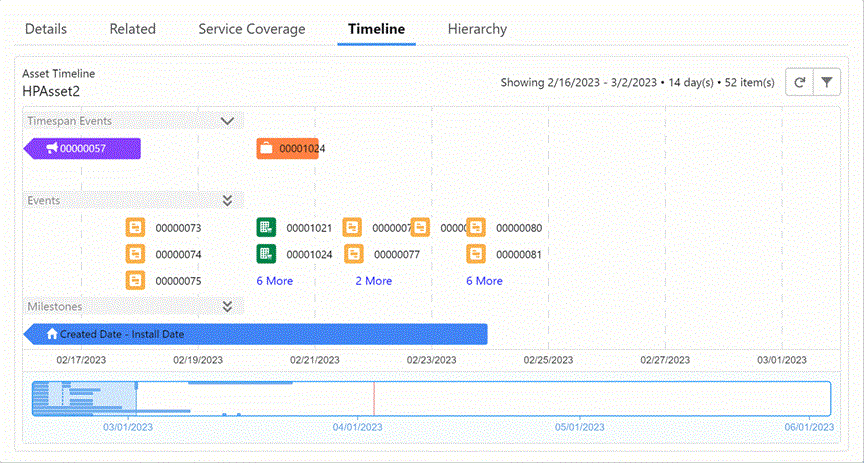 |
• Click the event or the name link on the popup to navigate to the respective record.
• When you click an event or a name in the record preview, the respective record is displayed on the same browser page and not on a new page or tab.
|
|
Expand and collapse configuration group sections
|
You can choose to expand and collapse any configuration group. For example, if you want to view the items in the Timespan Events section in detail, you can collapse the Events and Milestones sections, so that there is more space for the Timespan Events section.
|
• All the event sections are expanded by default.
• The Event and Milestone sections move down when you collapse the sections. This provides more space on the timeline for events from other sections to display.
• When a configuration group is not selected or configured, the section is not displayed. This provides more space on the timeline for events from other sections to display.
|
|
Show More option
|
When there are a large number of event items in a section, the first few items are displayed on the timeline, and the count of the remaining events is displayed with the More link.
For example, if there are 11 more items in the section, the link is 11 More. 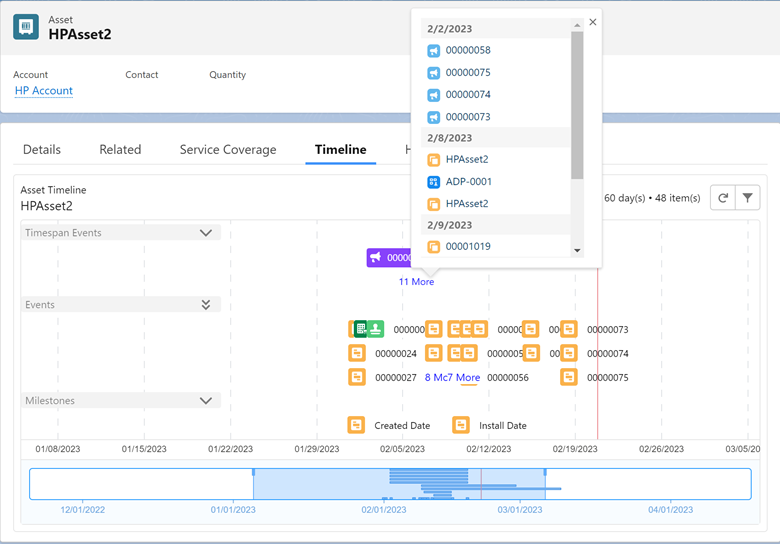 |
• The items are categorized based on date in the list displayed when you click the More link.
• Multiple links are displayed, date-wise, in the Events section only. For example, a link is displayed for 2/6/2023 and another link is displayed for 2/8/2023.
• In the More list, click any event to see the record preview on the popup modal to view more information about the event item. More information is displayed on the popup in the record preview mode.
|
|
Current date
|
A red vertical line indicates the current time. It allows you to differentiate past and future events with respect to the current time.
|
|
|
Refresh
|
Synchronizes the latest data for display.
|
|
|
Filter
|
Allows you to select and deselect the configuration groups from the list for display on the timeline. It also allows you to select a custom date range to see the asset-related information for that duration.
The selection is made as per the timeline configuration by default. 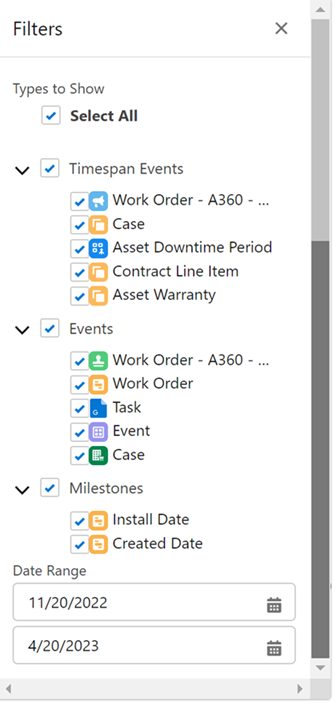 |
• Use the Select All option to select all types of configurations for display.
You can select the configurations to display based on specified criteria. For example, you can choose to display cases with the New status.
• The options present for selection in the filter are based on the object selection in the timeline configuration. You can choose to display or not display those configurations only.
Objects are listed in the order as configured in the timeline configuration.
• When you select multiple criteria for an object, the record that matches the first configuration is plotted on the timeline.
• You can select a maximum of 15 items for display. However, if the timeline configuration has more than 15 items, those items are displayed by default. The limitation of 15 items for display is applied only when you update the filter criteria.
• The date range is the total date range for which the timeline is being plotted.
The default date range is of five months - three months past the current date and two months after the current date.
|
|
Date range and count
|
Shows the total date range that is currently highlighted. This window is placed in the middle of the total date range by default.
The count of items indicates the number of events within the highlighted timeline bar.
|
• The default date range is of 14 days. • You can change the date range using the side arrows to drag the blue rectangle area. The following gif displays the dynamic date range placement. You can view that the date range changes as the blue rectangle area is moved. 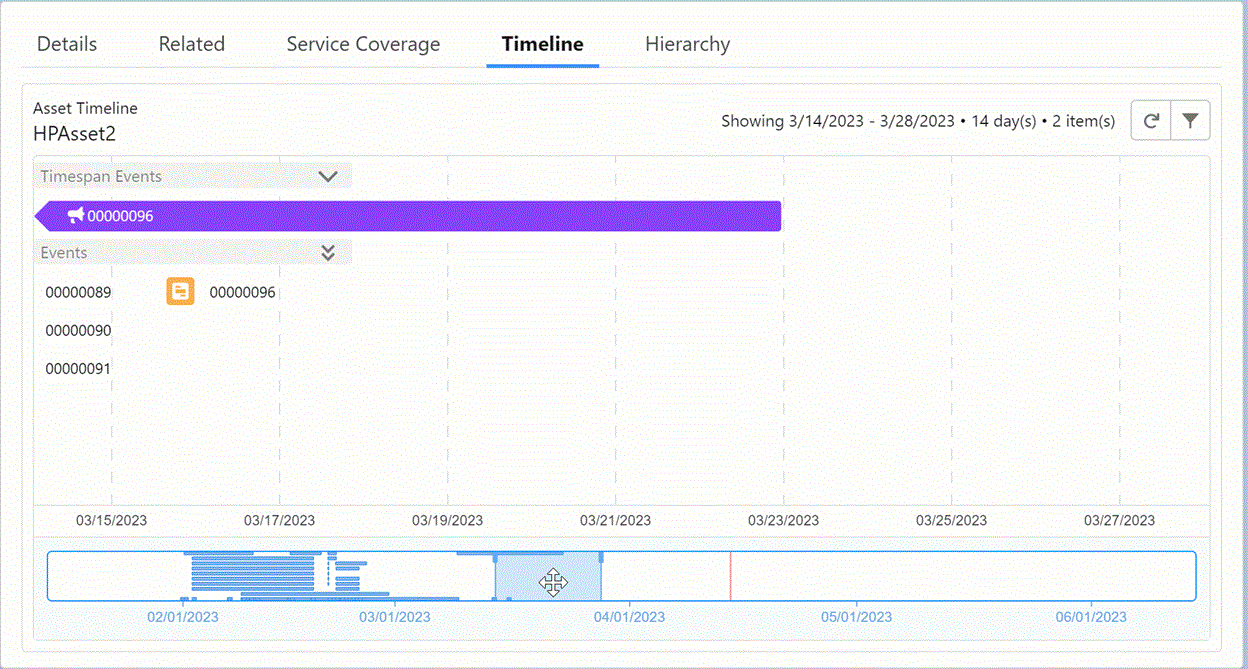 |
|
Blue rectangle area for a granular view
|
You can select a granular time range in the blue rectangle area to view the items in that specific time range. When you select a time range, the events displayed in the timeline update or plot dynamically to give you a more detailed view. For example, you can select the time range to view the items related to the asset in a day.
The following GIF displays the dynamic blue rectangle area view. 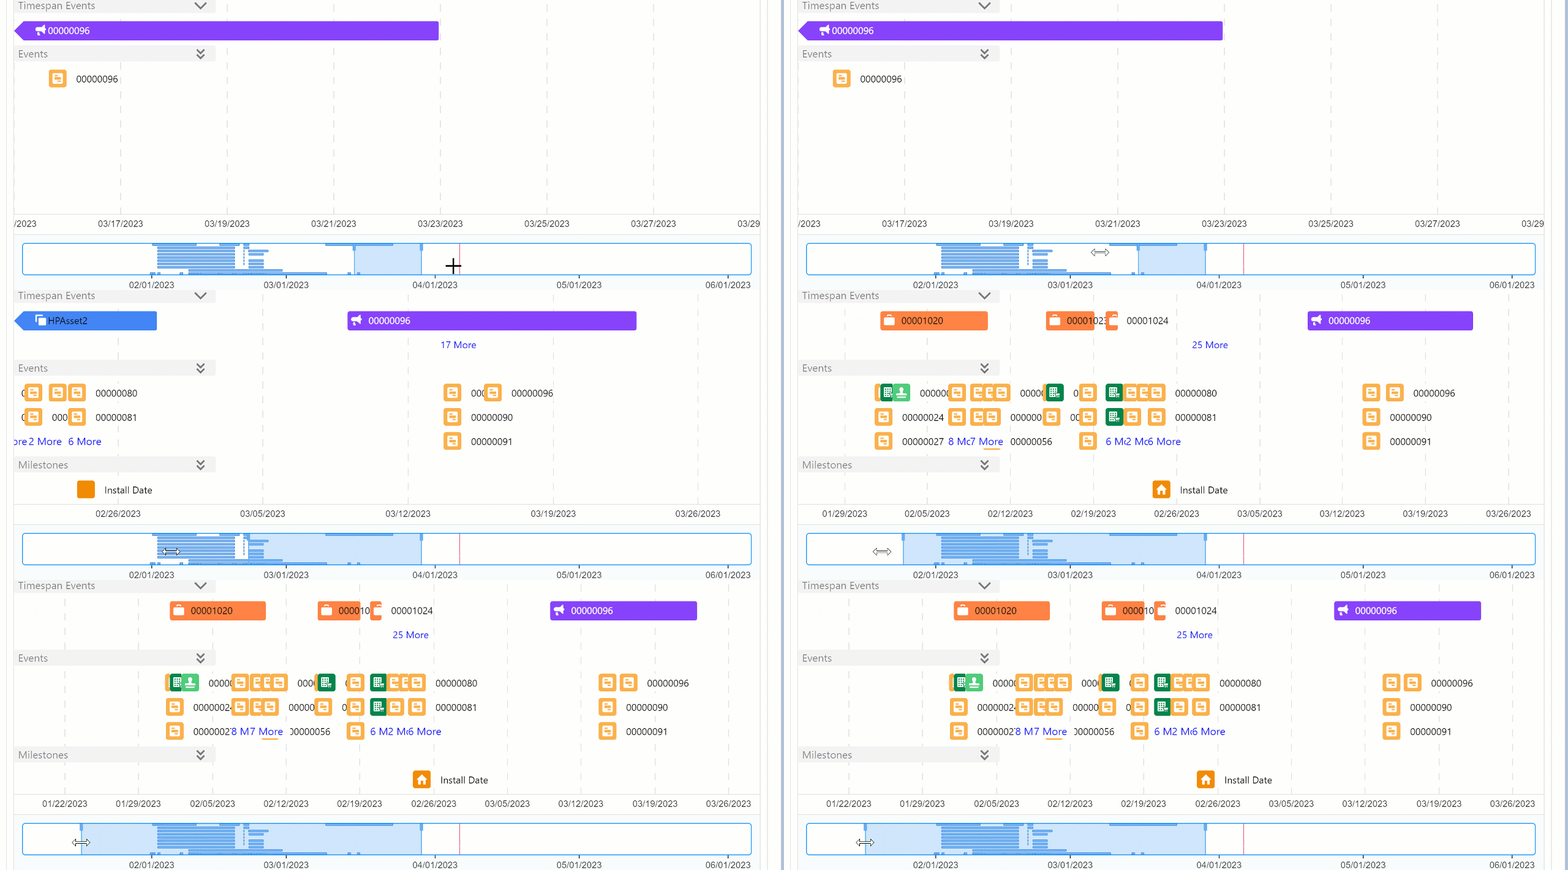 |
|
|
Zoom-in, zoom-out, and scrolling
|
You can zoom in, zoom out, and scroll through the timeline bar to view specific date ranges.
|