To Create a Waterfall Plot
1. In a worksheet, insert an XY plot.
2. To define the multiple traces of the waterfall plot, in the axes placeholders, type the following expressions:
|
Expression
|
Description
|
|---|---|
|
y-axis
|
A single matrix of y values
|
|
x-axis
|
A single matrix of x values
|
3. Change the trace type to Waterfall Trace. A waterfall plot appears with one trace per column of the x- and y-matrices.
Additional Information
• Waterfall plots are useful for plotting multiple data sets on a single plot.
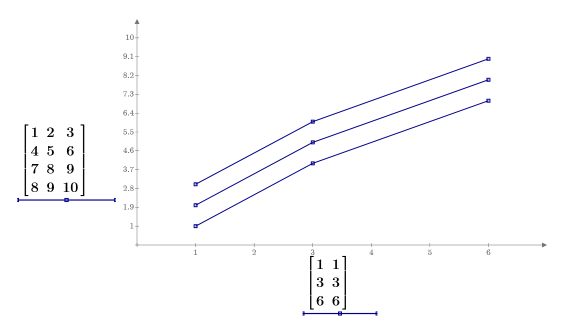
• If the matrices do not have the same numbers of rows, the extra rows are ignored. This happens when vectors are of different lengths. In the figure below, the last row of the y-matrix is ignored because there is no matching row in the x-matrix.
• If the matrices do not have the same number of columns, the last column of the shortest matrix is used for the missing columns. Below, PTC Mathcad uses the last column of the x-matrix twice to fill in the missing data.

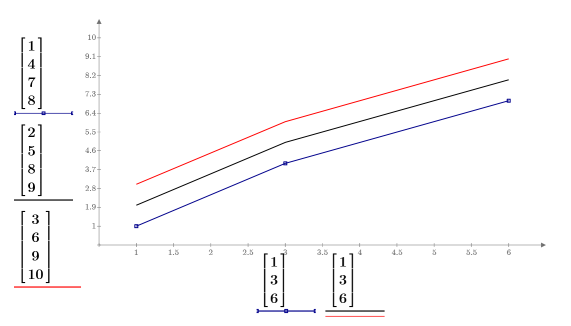
You can create an identical plot by defining each vector individually, as follows:  |