Example: Variance and Standard Deviation
1. Define data sets following a Weibull and a normal distribution.


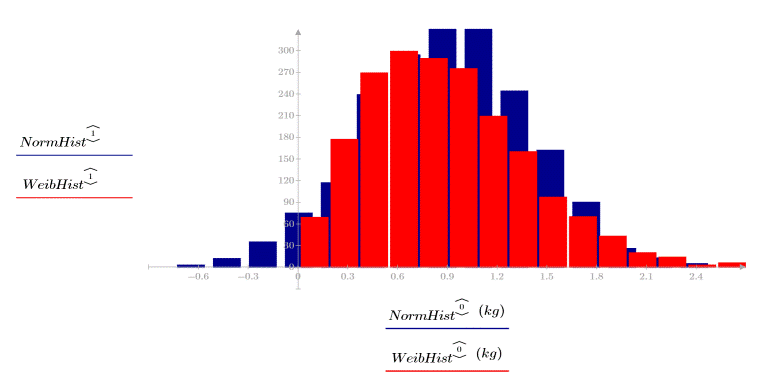
2. Plot the distributions.


The two data sets have different spreads and shapes, even though they have similar means:


3. Calculate the sample variance of the distributions.


The smaller variance of the Weibull distribution indicates that it is less spread than the normal distribution.
The sample variance is calculated as follows:


4. Calculate the sample standard deviation of the Weibull distribution.

The standard deviation has the same units as those of the original data, making it a slightly more intuitive measure of the dispersion than the variance. It can be considered a measure of the error in a series of measurements that should really be identical.
The sample standard deviation is the square root of the sample variance:

5. Calculate the population variance and standard deviations for the Weibull distribution:


The population variance and standard deviation are divided by the sample size, and not by the sample size minus one:


The sample variance, or function Var, is the more commonly used definition in quantitative data analysis. |