Example: Quantizing a Signal
Use the quantize function to quantize an analog signal. This is done by expressing the signal as a number of evenly-spaced, discontinuous levels.
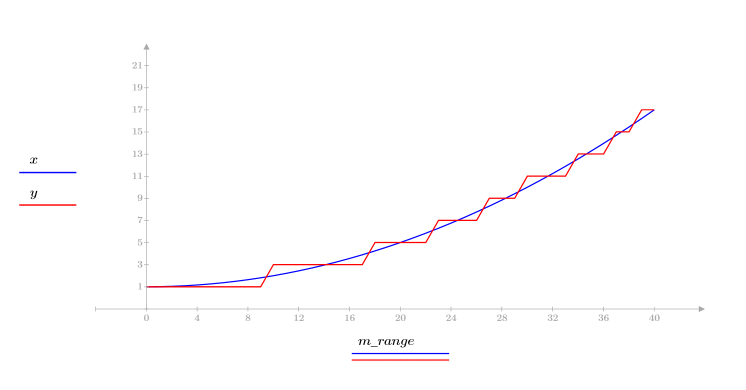
Quantizing a Hyperbolic Signal
1. Define the number of quantization levels.

2. Define the range and equation that represents the hyperbolic signal.


3. Calculate the height of each quantized level.


4. Quantize the signal.


• Quantized levels are not necessarily of uniform duration in time, nor does the original signal always cross the quantized signal at its midpoint.
• Most hardware implementations of digital signal processing techniques begin with an analog-to-digital converter chip, where the analog signal is quantized. If the frequency of the input signal is much slower than the inverse of the sampling rate, then quantization produces a fair approximation to the original analog signal, given the above method of choosing quantization levels. Otherwise, signal processing techniques must be used to restore the signal's structure.
Filtering and Reconstructing a Quantized Signal
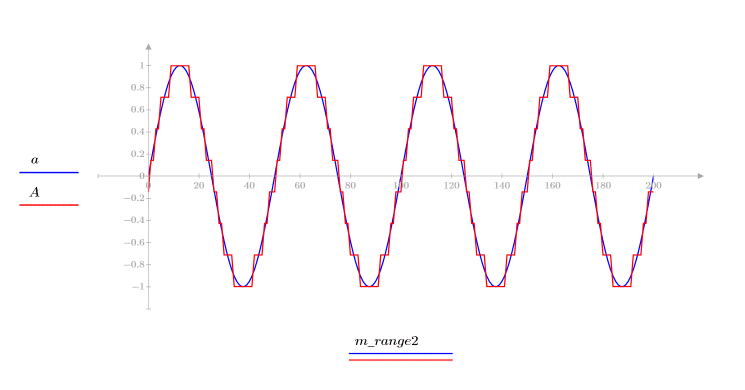
1. Take a sinusoid signal that has been quantized into 8 levels.


2. Quantize the signal.

3. Plot the original and quantized signals.

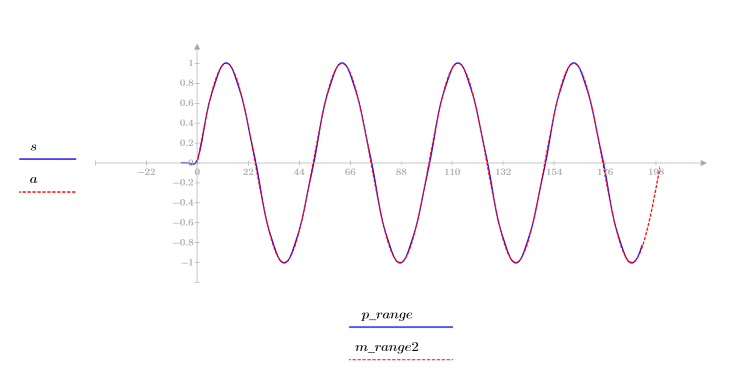
4. Use a lowpass FIR Filter with 15 coefficients, designed with a Hanning window (third argument below sets window) and experiment to find the right cutoff frequency.

The cutoff frequency is set to 0.12, and taper window to 4.
5. Filter the quantized signal using the response function.

6. Plot the filtered reconstruction s and the original signal a.


Quantizing an Array
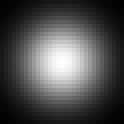
Quantize a Gaussian spot stored in a 2D array into 5 levels, and display the two arrays as grayscaled patch plots to show the visual effects of quantization.
1. Define number of quantization levels.

2. Define the ranges j and k.


3. Define the equation for the Gaussian spot X.

4. To facilitate the plotting of X, convert the elements to whole integers from 0 to 255 (by scaling and ceiling), and then zoom the matrix to get a large image.


(zzx.gif)
5. Quantize X over 4 levels.


(zzy.gif)