Example: NaN Detection and Removal
Use the markNaN function to mark outliers as NaN (Not a Number) in data sets. Use the IsNaN, matchNaN and filterNaN functions to manage NaNs.
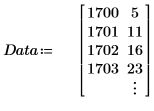
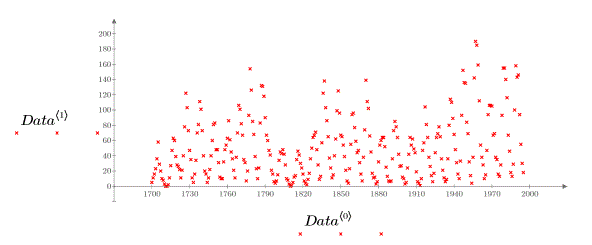
1. Read a file containing the number of sunspots recorded over the last three centuries, and plot the data.


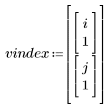
2. Use the ThreeSigma function to find the indices of the outliers.

The outliers are the number of sunspots recorded during the following years:


3. Use the markNaN function to mark as NaN the outliers in column 1 of the data.


Replacing data with NaNs indicates that a measurement was made, but the rows containing NaNs can be filtered out before processing.
4. Use the matchNaN function to find the indices of the spots that have been marked as NaN.

The data in rows 257 and 278 has been replaced by the built-in constant NaN:

5. Use the IsNaN function to check if the year 1957 has been marked as NaN in the Data and in the MarkedData sets.


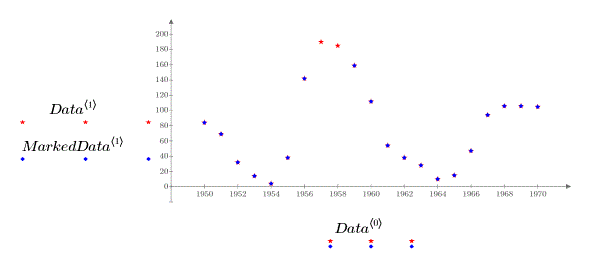
6. Plot the new data set, and compare it with the old set.

The outliers from the original data set are not highlighted in blue, since the plot skips the NaN recorded in the MarkedData set.
7. Use the filterNaN function to filter the matrix MarkedData set to remove the rows containing NaNs.


The number of rows in FilteredData has decreased by two.


Statistics can be collected for the FilteredData set, but not for the MarkedData set.