Example: Logarithmic Regression
logfit
Use the logfit function to fit data to the following logarithmic equation:

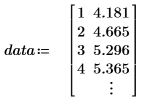
1. Define the following matrix.


2. Define a vector of guesses.

The function ln is only defined for positive numbers. The second parameter shifts the x data so that the ln can be computed. If your x data is negative, the second guess value should be positive and large enough to shift the x values to the positive axis.
In some cases, you must adjust the guesses to get the best possible fit. The first value should roughly describe the height and sign of your data, the second should reflect the horizontal offset, and the third the vertical offset. You can plot your data first to determine the guess values.
3. Use the logfit function to find the parameters for the logarithmic fit.


The second parameter is very small. The function lnfit is good alternative to logfit.
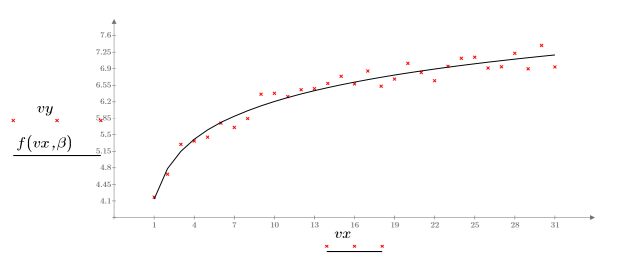
4. Plot the data and the logarithmic fit.

The fit is almost perfect, as confirmed by the correlation coefficient:

lnfit
Use the lnfit function to fit data to the following logarithmic equation:

1. Call lnfit to find the parameters a and b.

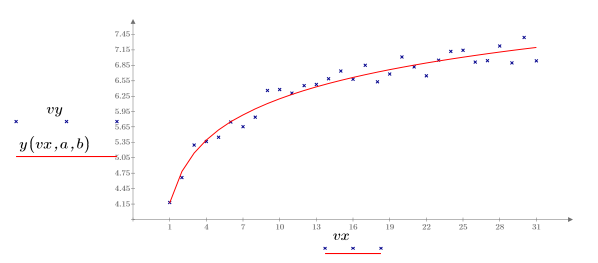
2. Plot the data and the fitting function.

3. Calculate the correlation coefficient.

This is very close to the correlation achieved with the logfit function.