Example: Filtering in the Frequency Domain
Use the idft function to map data in the frequency domain to the time domain.
Generally, the idft function is used to obtain a time-domain result after modifying transformed data in the frequency domain by filtering or windowing.
Signal with Noise
1. Define the number of data points.


2. Define the time interval.


The built-in function rnd returns a uniformly distributed random number between 0 and 2.
4. Plot the absolute values of the signal.
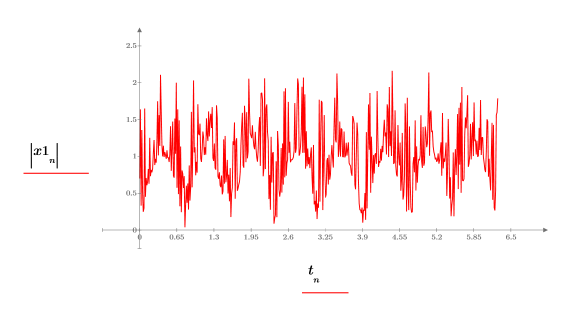
5. Use the dft function to transform the signal to the frequency domain, then plot its absolute values.

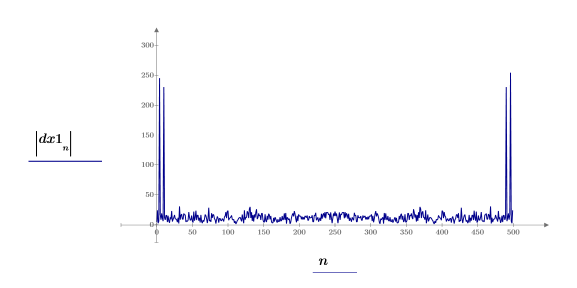
Most of the weight is at the low signal frequencies.
6. Locate the four peaks within the transform signal.


7. Use the if function to define a windowing function that rejects all transform elements except the two peaks at the highest and lowest time interval.

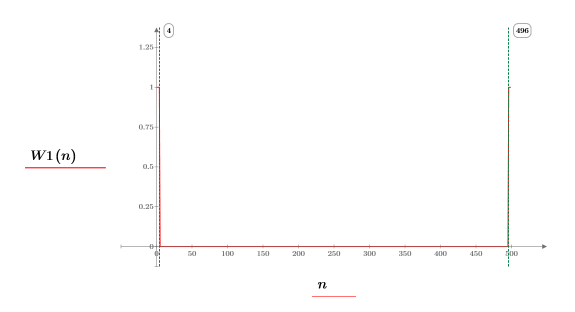
8. Multiply the transform by the W1 window.

9. Use the idft function to transform the new function back to the time domain.

10. Plot the original signal and the filtered waveform.
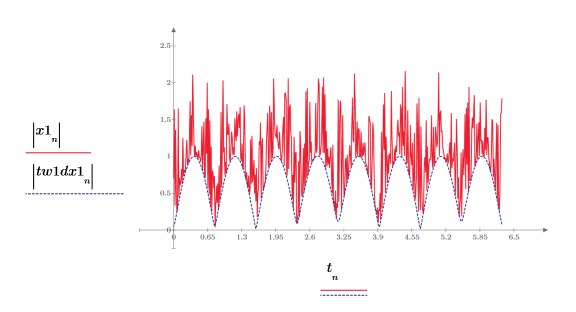
The filtered signal tracks the lower envelop of the original signal.
Signal without Noise
1. Define a new signal comprised of the original signal but without the random noise.

2. Plot the absolute values of the new signal.
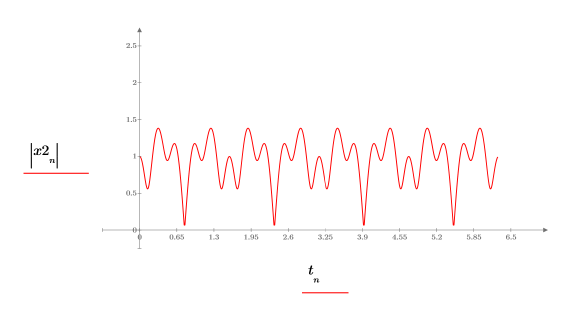
3. Use the dft function to transform the signal to the frequency domain, and then plot its absolute values.

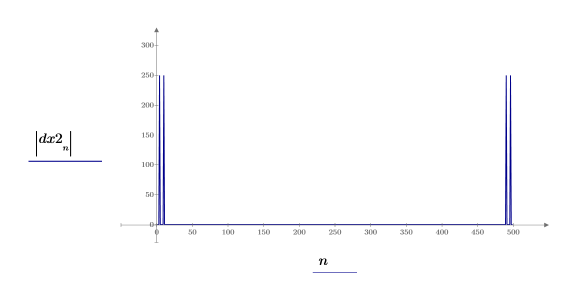
Most of the weight is at the low signal frequencies.
4. Locate the four peaks within the transform signal.


The peaks for the signal without the noise occur at the same frequencies of the original signal.
5. Use the if function to define a new windowing function that rejects all transform elements except the four peaks at the highest and lowest time interval.

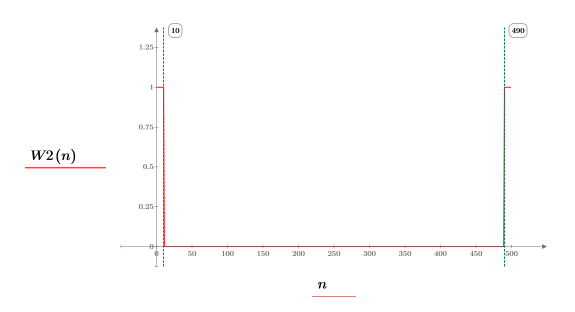
6. Multiply the transform of the original signal by the W2 window.

7. Use the idft function to transform the new function back to the time domain.

8. Plot the new signal and the filtered waveform.
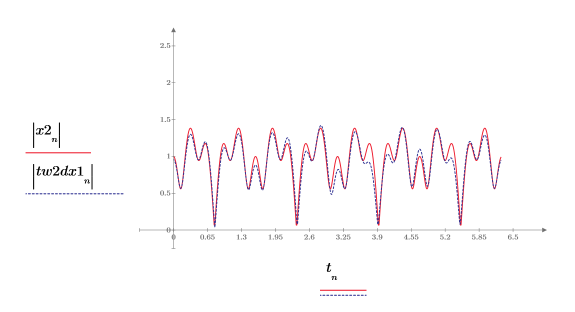
The filtered signal tracks the original signal without the added noise.