Example: Cepstrum and Complex Cepstrum
Use the cepstrum and ccepstrum functions to compute the cepstrum and complex cepstrum of a real-valued, multichannel signal.
The cepstrum maps convolution and deconvolution to addition and subtraction in the frequency domain, and has applications in speech and geophysical signal processing.
cepstrum
The cepstrum of sequence x(n) is given by the following formula:

where X(ω) is the Fourier transform of the sequence x(n).
This is the definition of the inverse transform after applying a natural logarithm to the Fourier transform of x(n). The logarithm maps convolution in the time domain to addition in the frequency domain, making cepstrum a convenient tool for signal deconvolution, which is mapped to subtraction.
1. Define the range of n.

2. Define the sequence function x.

3. Plot the sequence function x.

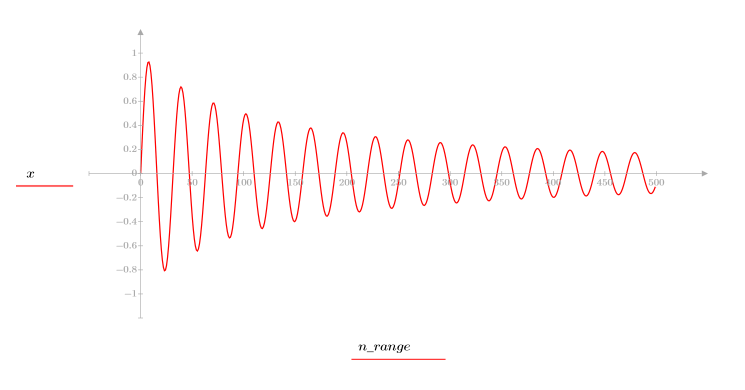
4. Calculate the cepstrum and plot the resulting function.

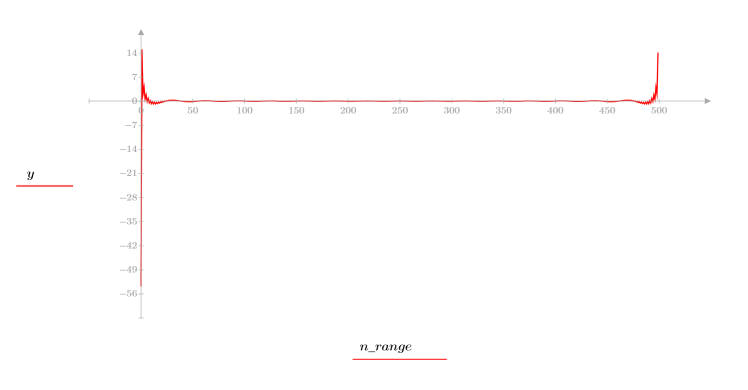
5. Use the recenter function to recenter the result to bring the first element to the middle.


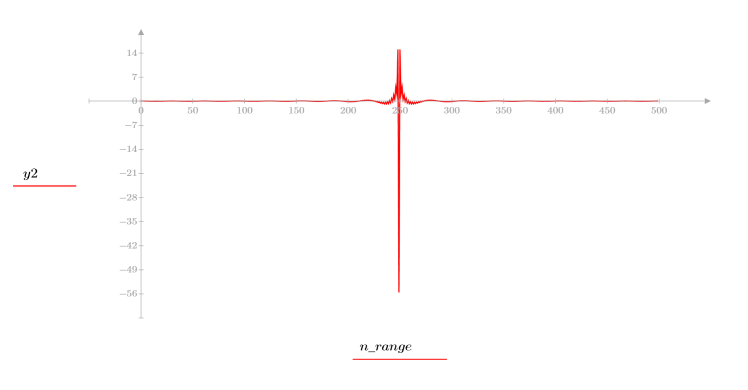
The original signal cannot be recovered from the cepstrum because the phase information is not retained.
ccepstrum
The complex cepstrum function is given by the following complex logarithm.

where: X(ω) is the Fourier transform of the sequence x(n), and phase is used to capture the phase information of the given sequence.
Comparing the ccepstrum of the output signal to those of the input and channel sequences demonstrates that the ccepstrum of the output is the sum of the ccepstrum of the input and channel. This is similar to adding the spectra of two signals in the frequency domain, but it is done in the time-domain.
The following example simulates a signal going through a communication channel which introduces echoes (following section 12.8.1 of Oppenheim and Schaefer, Prentice-Hall, 1989).
1. Define and plot the channel response as an FIR filter that introduces attenuated copies of another sequence (echoes).


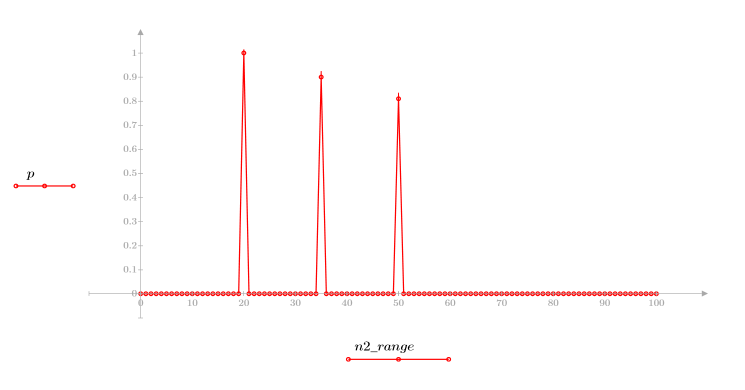
2. Define and plot the sequence v that will be convolved with the channel response.


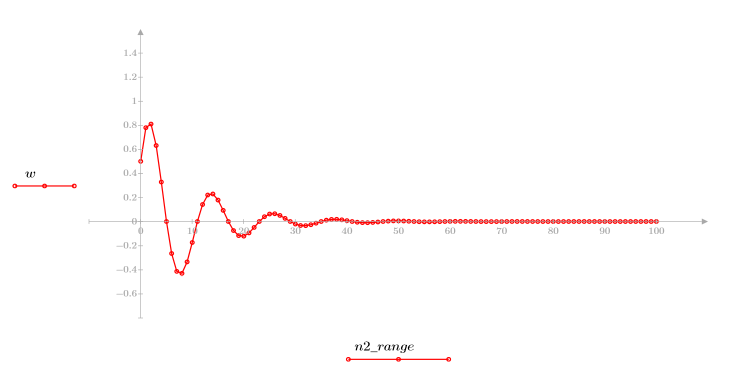


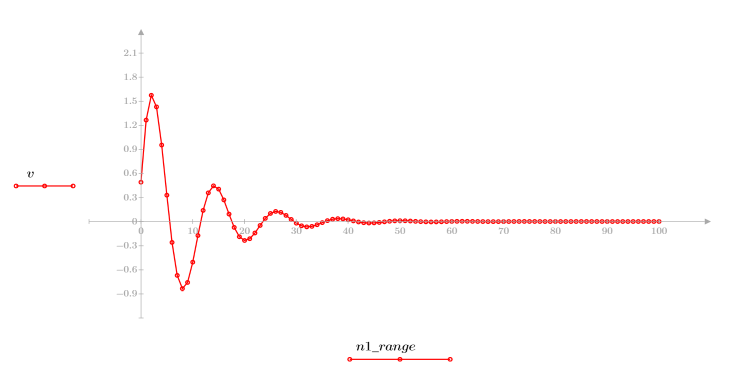
3. Use the response function to get the n-term vector response of input vector p to an FIR filter with coefficient array v (the communication channel function v).


4. Plot the response function.


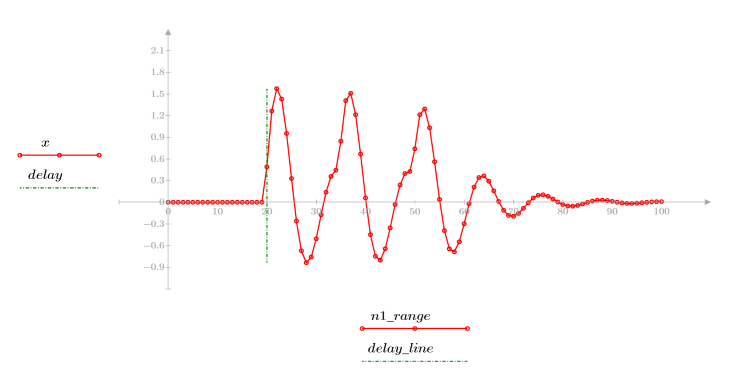
◦ The resultant sequence is the convolution of the input function p and the communication channel function v.
◦ The sequence shows the original signal plus the delayed replicas.
5. Compare the ccepstrum of the output signal to the cepstra of the original sequences. Recenter results to facilitate comparison.


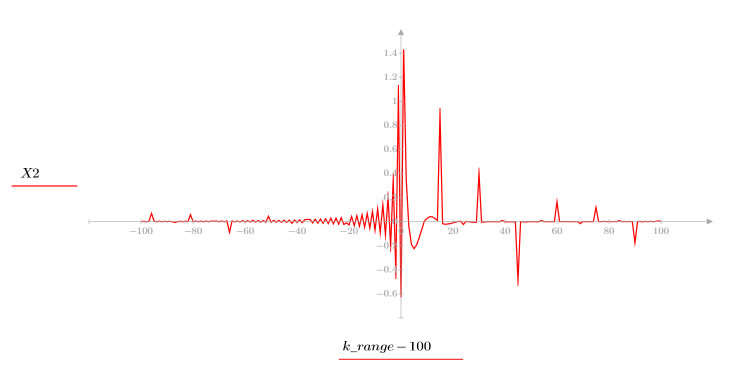
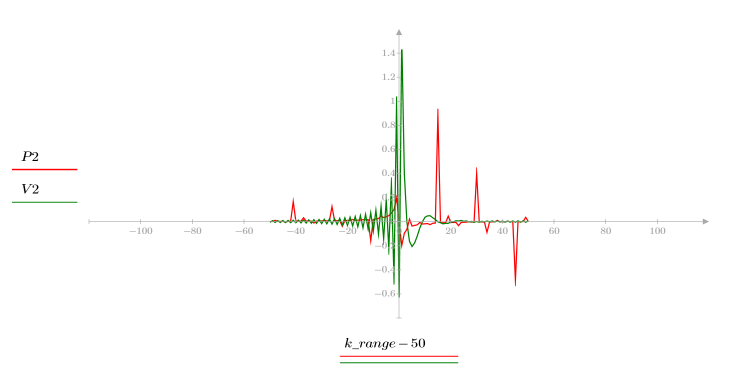
The plots above show that the ccepstrum of the output signal is the sum of the complex cepstra of the two sequences that were convolved with each other.