Example: ANOVA and Blocking
Use the block and anova functions to divide a design matrix into two blocks and to test if the blocking has an effect on the result.
1. Call the fullfact function to create a full factorial design matrix.
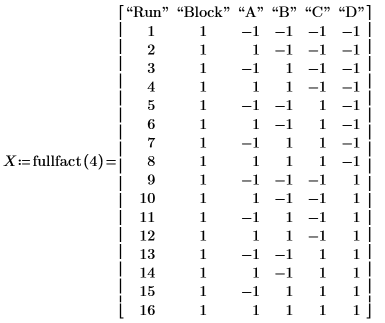
2. Call the block function to divide the design matrix X into two blocks.
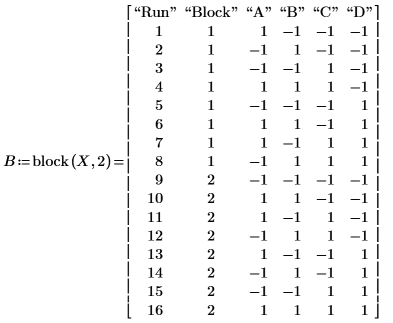
The first eight runs are in Block 1 and the remaining runs are in Block 2.
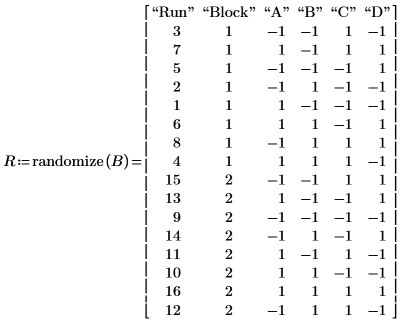
3. Call the randomize function before carrying out the experiment. The randomization is carried out separately for each block.
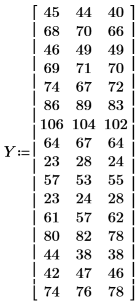
4. Record the experiment results in matrix Y with one row per run of the blocked design matrix B and one column per replicate.
5. Call the quickscreen function to calculate the effects of the factors, the second order interactions and the blocking.
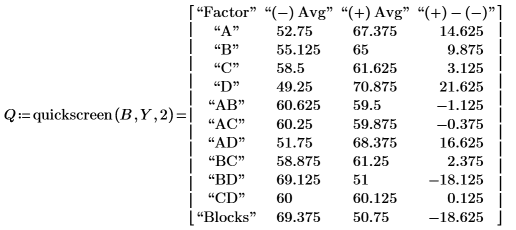
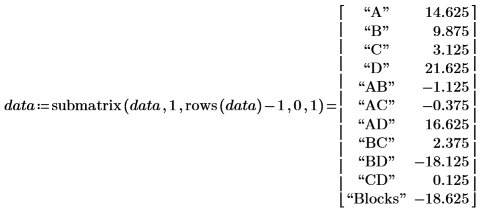
6. Use the augment and submatrix functions to extract the factors and their effects from Q, and remove the headers.

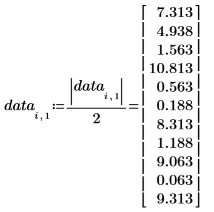
7. Replace the effects by the absolute value of the half effects.

8. Call the pareto function and then create a Pareto plot.
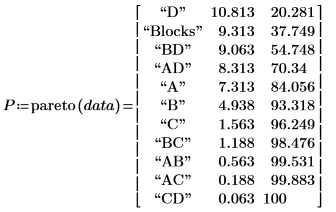
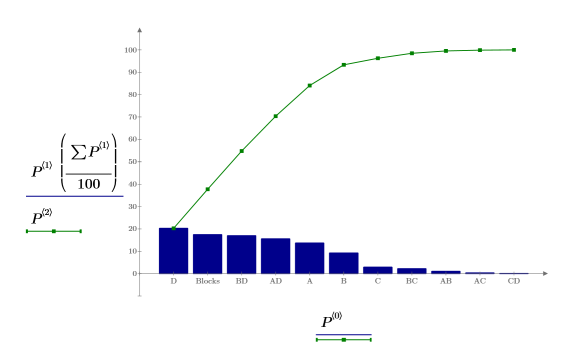
Factors A, B, D, interactions AD and BD, and Blocks seem significant.
9. Call the anova function to carry out an analysis of variance. Calculate the critical F-value for the factors, interactions, and blocking. Compare their F-value to the critical F-value.
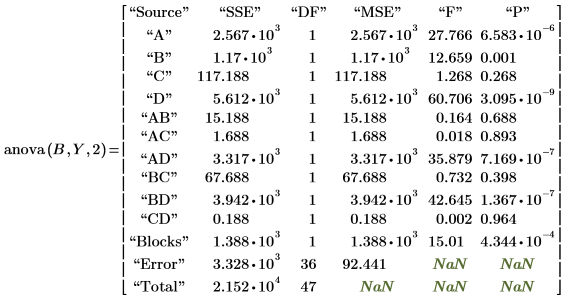
10. Use the qF function to calculate the critical F-value for the factors, interactions, and blocking. Compare their F-value to the critical F-value.
Set the level at 5%: |  |
Set the lowest degree of freedom DF: |  |
Set the highest degree of freedom DF: |  |
 | |
Factors A, B, D, interactions AD and BD, and Blocks are significant at the 5% level since their F values are greater than Fcrit. This analysis of variance reinforces the subjective conclusion derived from the Pareto plot.
Reference
Montgomery, D.C., Design and Analysis of Experiments, 5th ed., John Wiley & Sons, New York, 2001, pp. 295.