Example: Addition and Measurement of Noise
addnoise
Use the addnoise function to add or subtract noise of magnitude n (where n is any real number) to each element of M with probability p/2.
For information on using this example, refer to About Image Processing Examples.
1. Define the value for all the elements of a 5 × 5 matrix to be 127.


2. Add noise to matrix M so that +/-50 is added to half of the elements of M.

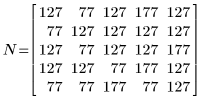
3. Use the READ_IMAGE function to read in an image, apply addnoise to it, and then use the WRITEBMP to write it to a file.


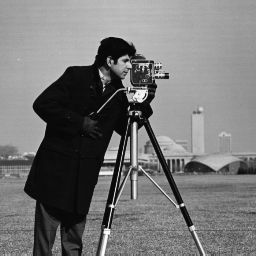 (camera.bmp) | 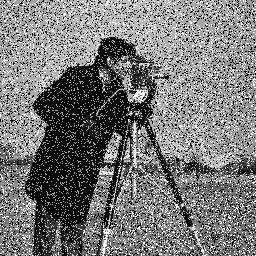 (noisy_camera.bmp) |
The function addnoise clips the resulting pixel values to the 0–255 range.
4. Apply the imhist function to the two images, and then compare the difference between the histograms in order to view the effect of the noise mathematically.


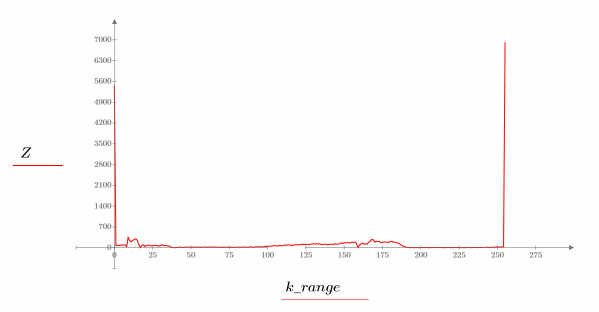
The large spikes of difference at 0 and 255 illustrate the clipping performed by the addnoise function.
Adding Noise Using Other Methods
You can generate other types of noise by constructing a mathematical expression.
1. To generate Gaussian noise, use the following expression:

gnoise is not a built-in function. A is the mean value of the noise and σ is the standard deviation.
Unlike the addnoise function, the Gaussian method does not clip the resulting pixel values to the 0–255 range.
2. Use gnoise to generate a noise matrix.


3. Plot a histogram of the noise.


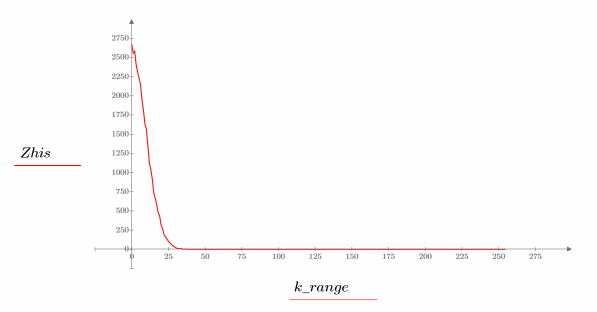
The histogram shows that most of the signal values fall in the first 30 histogram bins.
4. Insert the new image M2 which is the original image plus the noise.



(noisy_camera2.bmp)