Workflow Execution Time Trend
You can view the Workflow Execution Time Trend gadget on the Workflows Execution Status Page.
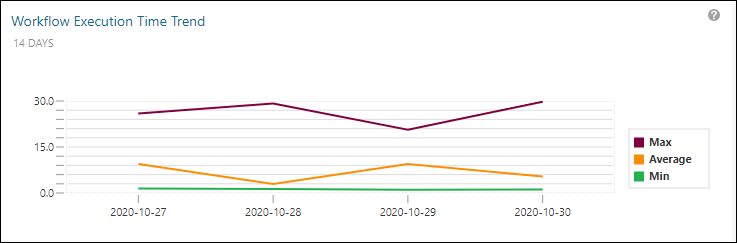
The Workflow Execution Time Trend gadget displays the maximum, minimum, and average workflow execution time for all workflows in the selected time frame in the form of a line chart.
Hover the cursor over different data points to view the maximum, minimum, and average workflow execution time for all workflows on a particular date.