Scenario Details
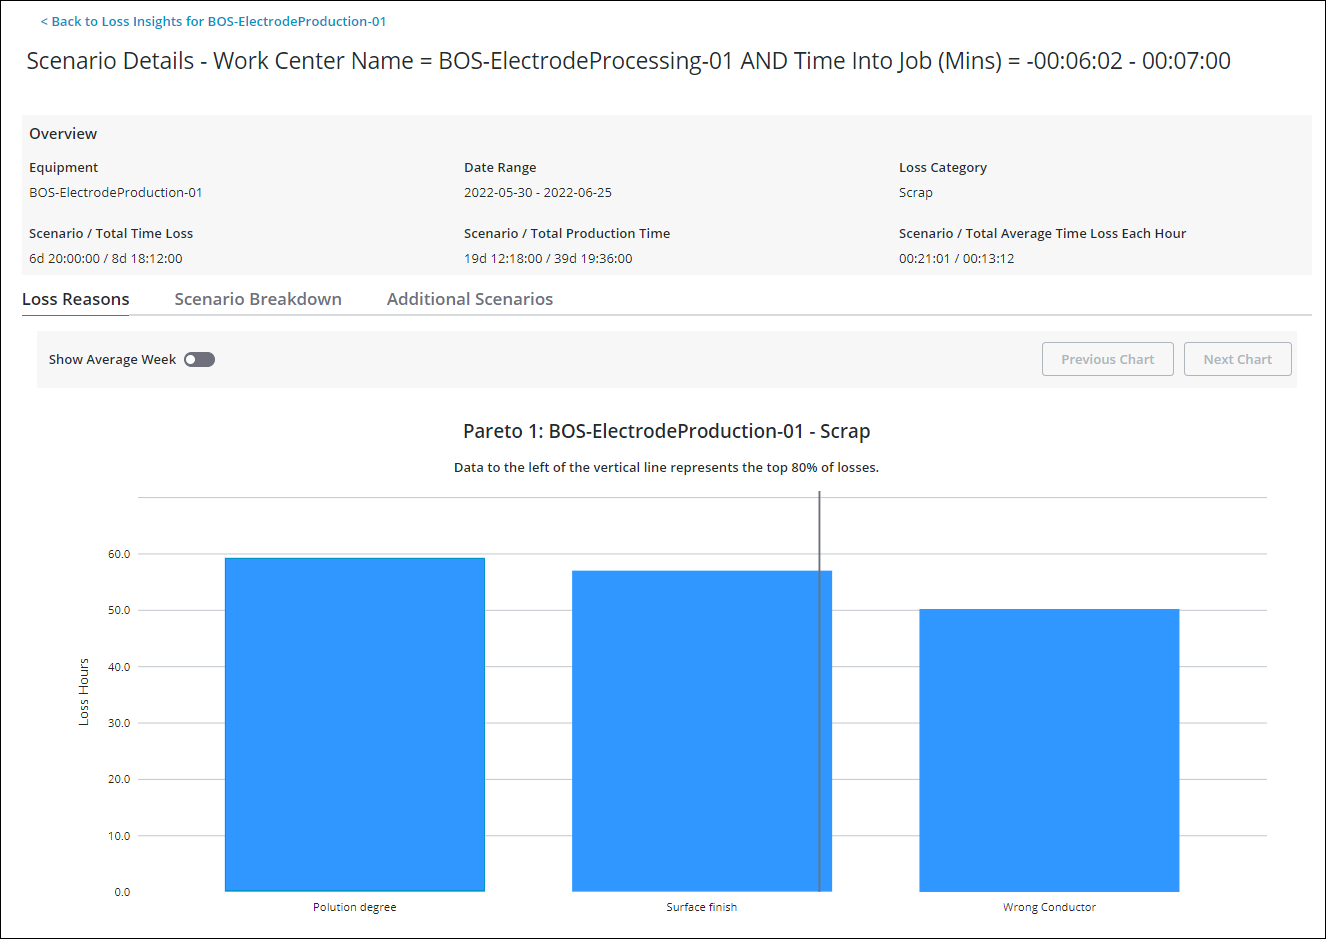
The Scenario Details page allows you to explore additional information about individual scenarios. You can access this page by clicking View Details for a scenario on the Loss Insights page.
On the Scenario Details page you can see the following tabs:

The Overview pane updates to show values for the selected scenario:
• Scenario / Total Time Loss— The total time loss of the selected loss category for the production blocks within the selected date range on the selected equipment for the scenario.
• Scenario / Total Production Time— The total production time for all production blocks within the selected date range for the selected equipment for the scenario.
• Scenario / Total Average Time Loss Each Hour— The total average time loss per hour for the selected loss category for the selected equipment for the scenario.
Loss Reasons
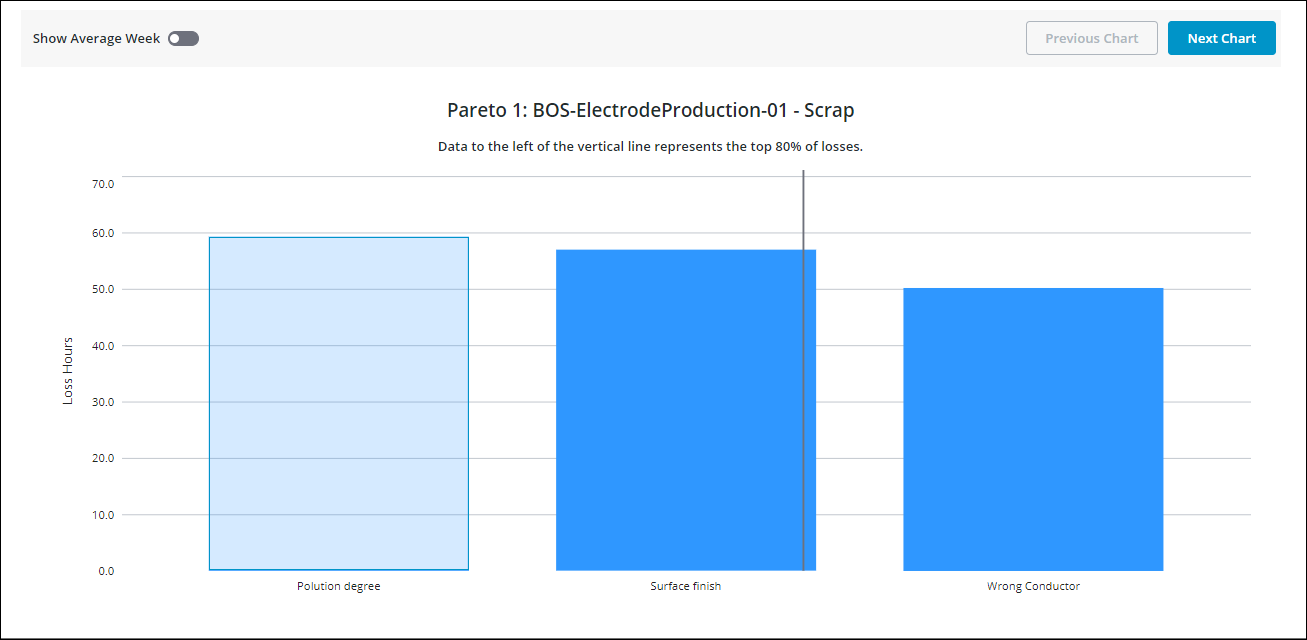
On the Loss Reasons tab, you can view a Pareto chart showing the loss reasons included in the scenario. The data to the left of the vertical line in the Pareto chart represents the top 80 percent of losses for the scenario.

Select a loss reason bar and click Next Chart to view the next level Pareto chart or trend chart.
Click Previous Chart to return to the previous chart.
Scenario Breakdown
On the Scenario Breakdown tab, you can explore further details about the scenario.

The Scenario Breakdown table displays the following information:
• Value— The value of the feature.
• Time Loss— The total time loss of the selected loss category for the production blocks within the selected date range on the selected equipment for the scenario.
• Total Production Time— The total production time for all production blocks within the selected date range for the selected equipment for the scenario.
• Average Time Loss Each Hour— The average time loss per hour for the selected loss category for the selected equipment for the scenario.
• Deviation from Average— The deviation from the average time loss per hour for the selected loss category for the selected equipment for the scenario.
To view scenario details for a feature in the table, select a row and click View Scenario. This takes you to the Scenario Details page for the selected feature. For example, if you select the first row, PreviousProductionPack=4-Pack and click View Scenario, you will be taken to the Scenario Details page for PreviousProductionPack=4-Pack. If you select the second row, CurrentProductionPack=2-Pack and click View Scenario, you will be taken to the Scenario Details page for PreviousProductionPack=4-Pack AND CurrentProductionPack=2-Pack.
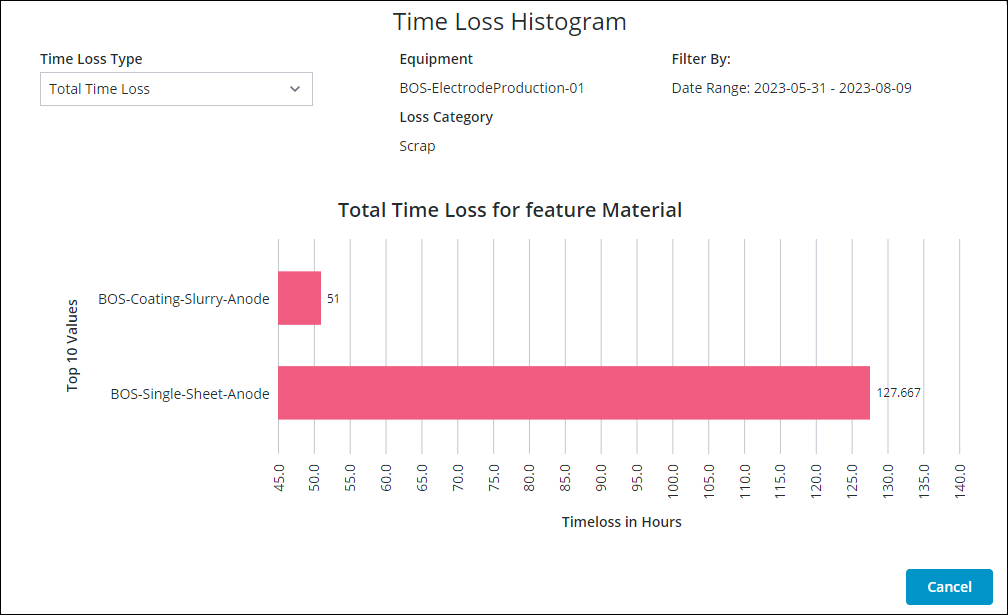
To view a histogram showing the distribution of the different feature values and their loss hours, select a row and click View Chart. The Time Loss Histogram window opens. You can switch between viewing Total Time Loss and Average Time Loss from the dropdown list. The default is Total Time Loss.

Additional Scenarios
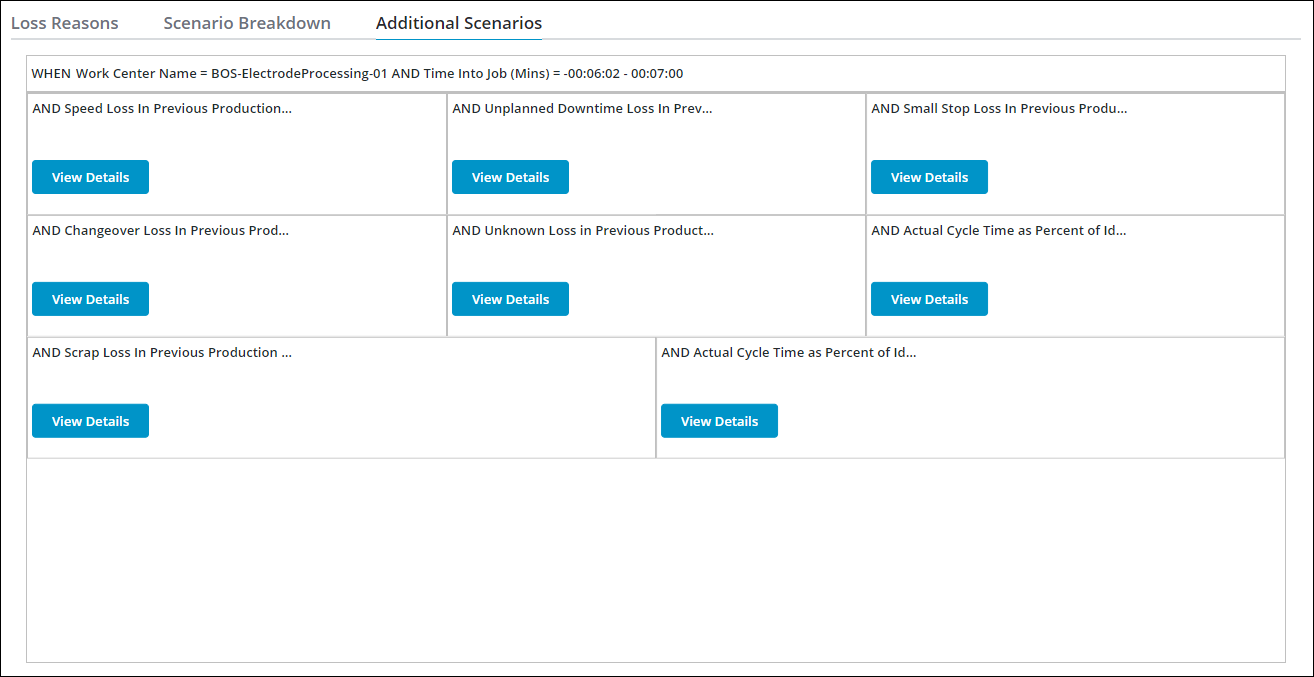
The Additional Scenarios tab is enabled when a scenario has fewer features than the defined Maximum Depth. Click View Details in a scenario card to view the Scenario Details page for that scenario.
