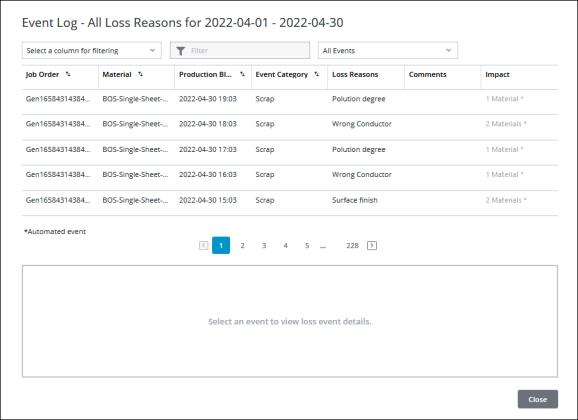
Event Log Mashup
|
|
This mashup is designed to be easily replaced with a customized mashup so long as the customized mashup has the same inputs and outputs. For more information, see Replacing Modular Mashups.
|
The event log mashup (PTC.PerformanceAnalysis.EventLog_MU) is the window that displays when the View Event Log button is clicked from a waterfall, Pareto, or trend chart.

Widgets
The PTC.PerformanceAnalysis.EventLog_MU mashup uses the following widgets:
• Two DropDown widgets, for the Select a column for filtering drop-down field, and the event views drop-down field.
• A Text Field widget, for entering filter information.
• A Grid widget, for the event log table.
• A Pagination widget.
• A Contained Mashup widget, for the pane at the bottom,
• A Button widget, for the Close.
• Multiple Label widgets, for text strings.
Inputs
The input parameters for the PTC.PerformanceAnalysis.EventLog_MU mashup are:
• materialMasterUid—The UID for the material selected in the applied Material filter.
• managerName—The name of the manager Thing from which the services on this mashup are run. This value is passed in from the main Performance Analysis mashup (PTC.PerformanceAnalysis.Analysis_MU).
• thingName—The name of the Thing for the equipment selected in the applied Equipment filter.
• endDate—The end date from the applied Date Range filter.
• startDate—The start date from the applied Date Range filter.
• selectedBar—An infotable containing the information for the bar that is selected in the waterfall or Pareto chart.
• navigationHistory—An infotable containing the navigation history of the selected loss categories and reasons as you navigate through the waterfall and Pareto charts.
Outputs
The PTC.PerformanceAnalysis.EventLog_MU mashup has no output parameters.
Services
The mashup uses the following dynamic services from the PerformanceAnalys.Management_TS Thing Shape:
• GetEventLogData—Retrieves all events to show in the event log table
• GetEventLogDataCount—Retrieves the count of all events in the event log.
• GetEventLogFilterOptions—Retrieves the columns which can be filtered on. When the Unaccounted Time blue bar was selected in the waterfall chart, the Job Order and Material columns can be filtered on. For all other selected bars, the Job Order, Material, Event Category, and Loss Reason columns can be filtered on.
• GetEventLogSortingOptions—Retrieves the options for the event views drop-down: All Events, Scrap Only, and Alerts Only.
• GetEventLogTitle—Retrieves the information for the event log title, including the selected reason (if any) and the date range.
• GetLossEventDetailsMashup—Retrieves the name of the mashup to display in the bottom pane.
• IsUnaccountedBarSelected—Boolean indicating whether the Unaccounted Time bar was selected when launching the event log. If true, then event views filter is disabled.
Dynamic services allow you to select the entity to execute a service at runtime. In this case, the service can be executed from any entity that implements the PTC.PerformanceAnalysis.Management_TS Thing Shape. For more information, see Dynamic Services in the Mashup Builder section of the ThingWorx Help Center.