Using the Event Log
The event log lists the loss events for the work center, either for the current production block or the past 24 hours, depending on whether you are viewing the collapsed event log view or the expanded event log view.
In either event log view, events with alerts are indicated with an alert icon ( ). An alert on an event means that the reason selected for the event is not at the lowest level of the reason tree. Until the alert is addressed, your data will not be complete for the Pareto and trend charts in Performance Analysis. To clear an alert, edit the loss event and select a loss reason that is at the lowest level of the reason tree.
To edit a loss event, click the event in the event log.
Automated events in the event log are indicated with an asterisk ( * ) after their duration when they have completed. These are events that are entered using data automation rather than being manually entered through the Production Dashboard. They have a start time and continue until a new event starts. Events shown in the event log with no duration are automated events that have not yet completed. The duration displays once the automated event is complete. Automated events that are not complete cannot be edited.
Collapsed Event Log View
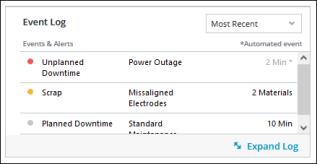
The collapsed view of the event log displays in the Event Log pane on the Production Dashboard. This view shows the most recent events for the current production block by default. For each event, the loss category for the event, the selected loss reason, and the impact (duration or quantity) is displayed.

There are multiple filters available for the Event Log pane:
• Most Recent—Displays the most recent events at the top of the list. This is the default view.
• Alerts First—Displays events with alerts at the top of the list.
• Alerts Only—Displays only events with alerts.
To view events for the work center outside of the current production block, click Expand Log.
Expanded Event Log View
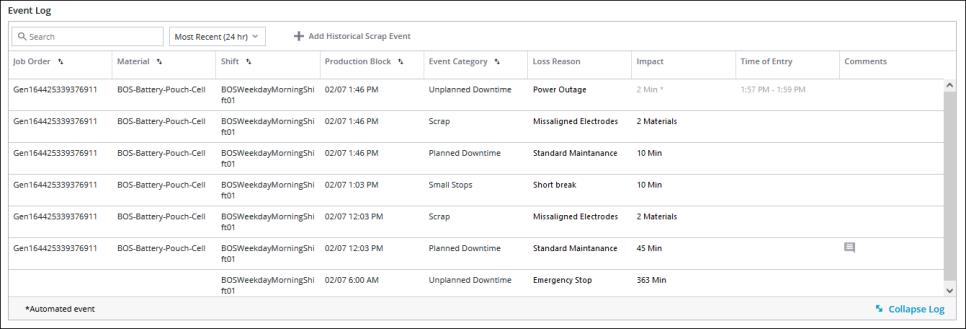
The expanded view of the event log displays all loss events for the work center for the past 24 hours, or all scrap loss events from the past week, depending on your filter settings. Loss events older than the past 24 hours and scrap loss events older than a week can no longer be viewed in the expanded event log.

For each event, the following information is displayed:
Column | Description | ||
|---|---|---|---|
Job Order | The job order associated with the event. If the loss event is entered for a time gap production block, this field is blank. This field may be blank for automated loss events. | ||
Material | The material associated with the event. If the event is entered for a time gap production block, this field is blank. This field may be blank for automated loss events. | ||
Shift | The name of the shift during which the event occurred. If the loss event occurred outside of a scheduled shift, then Overtime displays. This field may be blank for automated loss events. | ||
Production Block | The date and start time of the production block during which the event occurred. This field may be blank for automated loss events. | ||
Event Category | The loss category for the event. | ||
Loss Reason | The loss reason for the event. If no loss reason is selected for the event, the value is displayed as Missing along with an alert icon ( | ||
Impact | The quantity for scrap loss events or duration for all other loss events.
| ||
Time of Entry | For automated loss events, the time when the entry was recorded. This field is blank for manually entered loss events. | ||
Comments | If there is a comment on the event, a comment icon ( |
There are multiple filters for the expanded event log:
• Most Recent (24 hr)—Displays events for the past 24 hours with the most recent events at the top of the list. This the default view.
• Alerts First (24 hr)—Displays events with alerts ( ) from the past 24 hours at the top of the list. An alert on an event means that the reason selected for the event is not at the lowest level of the reason tree. Until the alert is addressed, the time loss for that event is not accounted for.
• Alerts Only (24 hr)—Displays only those events with alerts from the past 24 hours.
• Scrap Only (Week)—Displays only loss events with the Scrap loss category from the past week.
You can narrow the list of events by entering text in the Search field. The list can also be sorted on the following columns: Job Order, Material, Shift, Production Block, and Loss Category.
From the expanded view of the Event Log, you can add historical scrap events.
To return to the collapsed event log view, click Collapse Log.