Trend Chart Mashup
|
|
This mashup is designed to be easily replaced with a customized mashup so long as the customized mashup has the same inputs and outputs. For more information, see Replacing Modular Mashups.
|
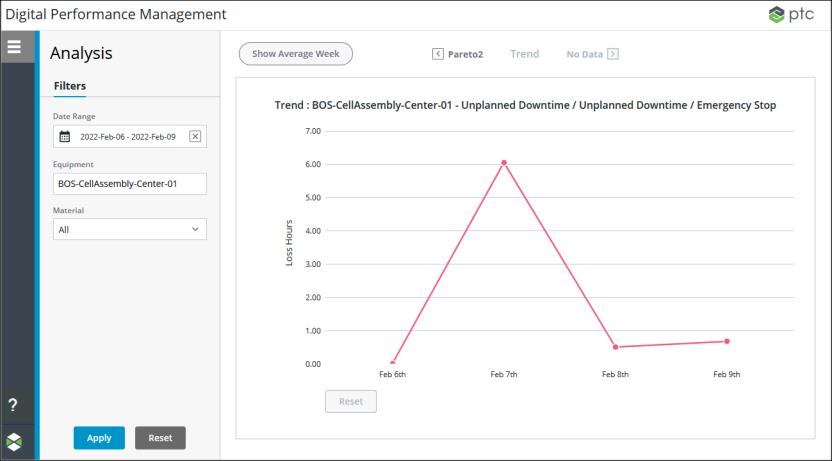
The trend chart mashup (PTC.PerformanceAnalysis.Trend_MU) displays trend data for the selected reason once a leaf node (lowest level) of the reason tree has been reached.

The information displayed in the trend chart is determined by the applied filter selections and the reason selected in the previous chart. You can zoom in by selecting and dragging over a portion of the chart, and return to the full chart display by clicking Reset.
For more information, see Trend Analysis Chart.
Widgets
The PTC.PerformanceAnalysis.Trend_MU mashup uses a single Line Chart widget.
Inputs
The input parameters for the PTC.PerformanceAnalysis.Trend_MU mashup are:
• chartTitle—The title displayed in the chart widget.
• endDate—The current date in the user’s local time zone or the end date from the applied Date Range picker, which ever is earliest.
• managerName—The name of the manager Thing from which the services on this mashup are run. This value is passed in from the main Performance Analysis mashup (PTC.PerformanceAnalysis.Analysis_MU).
• materialMasterUid—The UID for the material selected in the applied Material filter.
• navigationHistory—An infotable containing the navigation history of the selected loss categories and reasons as you navigate through the waterfall and Pareto charts. Used by the GetTrendDisplayData service to build the tooltip for the trend chart.
• startDate—The start date from the applied Date Range filter.
• thingName—The name of the Thing for the equipment selected in the applied Equipment filter.
Outputs
The PTC.PerformanceAnalysis.Trend_MU mashup has no output parameters.
Services
The mashup uses the following dynamic service from the PTC.PerformanceAnalysis.Management_TS Thing Shape:
• GetTrendDisplayData—Retrieves the data to be displayed in the trend chart.