Viewing an Action
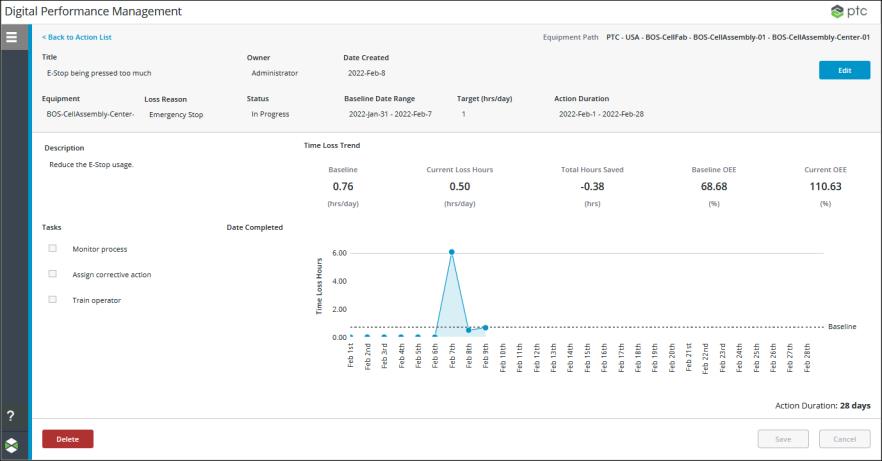
To view an action, select the action in the actions list and click View Action. The action details page opens in view mode. This page displays the action information, including the full path for the selected equipment, date created, any tasks for the action, and the Time Loss Trend chart.
While viewing an action, you can perform the following actions:
• Click Delete to delete the action.

The Time Loss Trend chart shows the loss hours each day related to the equipment and loss reason that are set for the action, over the action duration date range. If a work center is the selected equipment for the action, this is the sum of all events with the selected loss reason that are caused by any work unit in the work center. If a work unit is the selected equipment for the action, this is the sum of all events against from the selected work unit with the selected loss reason.
If the selected loss reason has child nodes in the reason tree, the loss hours are aggregated for the selected loss reason and all of its child reasons.
The data shown in the Time Loss Trend chart includes data from all loss events for the selected equipment during the action duration for which the loss category and loss reason on the event match the loss category and loss reason selected as the Loss Reason for the action. The event category for those loss events is not considered for this chart. This is different from the trend charts shown in Performance Analysis. Those trend charts show data from all loss events which match the event category, loss category, and loss reason that you selected while navigating through the waterfall and Pareto charts to reach the trend chart. |
A data point for each day is plotted on the chart. The data point is plotted at 0 for days that fall on or before the current date and that have no production or time loss data for the selected equipment and loss reason.
The difference between the Baseline value and the Target (hrs/day) value is shown as a horizontal line on the chart.
The chart also shows the following key performance indicators (KPI) related to the action:
• Baseline—The baseline time loss on which you want to improve, measured in hours per day. This is the average daily loss hours calculated for the Baseline Date Range. This value is also shown as a grey horizontal line on the chart itself.
• Current Loss Hours—The loss hours for the previous day for the selected equipment and loss reason. A day is a 24-hour period between midnight and midnight in the current user’s time zone. If there were no loss hours for the previous day, this value is shown as 0.
• Total Hours Saved—The total loss hours saved since the action started. This is calculated as the sum of the differences between the baseline and the total actual loss hours for each day since the start of the action duration. If both the start time and end time for the action duration are in the past, the total hours saved are calculated for the complete action duration. If the start time for the action duration is in the past, but the end time is in the future, the total hours saved are calculated from the start time until the current day. If both the start time and the end time for the action duration are in the future, this value is not calculated.
• Baseline OEE—The average OEE calculated for the work center over the number of days in the Baseline Date Range. If the action is against a work unit, this is the value calculated for the work center to which the work unit belongs.
• Current OEE—The OEE calculation for the work center for the previous day with loss hours for the selected loss reason. If the previous day or days had no production data, this field displays the OEE for the most recent day with production data within the last 31 days. A day is a 24-hour period between midnight and midnight in the current user’s time zone. If the action is against a work unit, this is the value calculated for the work center to which the work unit belongs.
• Action Duration—The total number of days in the action’s duration, and the date range shown in the Time Loss Trend chart.
The formula used for the Baseline OEE and Current OEE calculations is: [Effective Time / (Planned Production Time + Unplanned Production Time)] * 100.