Examining the results
1. Click the Results tab at the bottom of the application interface to view the analysis results
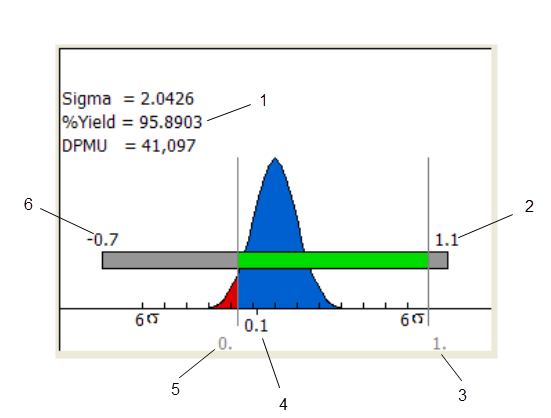
The Analysis Results view has two display regions. The left region shows a variation plot for the measurement. The variation plot shows the statistical variation plot and the worst-case range for the measurement based on the specified tolerances for the dimensions in the dimension loop. (See the figure below.)
1. Quality Metrics
2. Maximum WC value of measurement
3. Upper Measurement Limit
4. Measurement Target Value
5. Lower Measurement Limit
6. Minimum WC value of measurement
The right region of the Results view is a tabbed display of contribution and sensitivity plots. For example, the Statistical Contribution plot shows the percent contribution of each dimension to the variance of the measurement.
The results indicate that two of the dimensions from the PCB are the largest contributors (d266 and d43).
2. Click on the tolerance field for the d266 dimension in the PCB. Change the tolerance to ±.1.
3. Click on the tolerance field for the d43 dimension in the PCB. Change the tolerance to ±.1.
Notice that when you make a change to the tolerance, the results automatically update. You can continue to change the tolerance values until you get the desired measurement variation. Note that the actual PTC Creo Parametric dimension properties are not modified until you close the Tolerance Analysis Powered by CETOL Technology interface and accept the changes.
When the analysis process is complete, you can generate an HTML report of the analysis.
4. Click
Generate Report 
.
The report is displayed in the Creo Parametric.