Power Inverter with Conjugate Heat Transfer: Exercise 6—Analyzing Results
This exercise describes how the results are analyzed during and after the simulation. To hide CAD surfaces (not the fluid domain), switch between  CAD Bodies and
  Flow Analysis Bodies. Clear any variable display by selecting No Selection in the Legend drop-down. Click
  XYPlot Panel to view the XY Plot.
CAD Bodies and Flow Analysis Bodies. Clear any variable display by selecting No Selection in the Legend drop-down. Click XYPlot Panel to view the XY Plot.1. To show/hide selected geometric entities, click  Show in View Panel. Show in View Panel.2. To change the color scheme, click on  More in the Legend and select between Blue Red and Blue Purple. More in the Legend and select between Blue Red and Blue Purple. |
Viewing the Pressure Contours on a Boundary
 | Temperature K 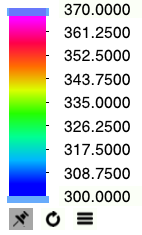 |
1. Select Domains.
2. In the  Turn on/off view properties list, click
  Hide all surfaces,
  Hide all grids, and
  Hide all outlines.
Turn on/off view properties list, click Hide all surfaces, Hide all grids, and Hide all outlines.3. Under Domains, select all entities except POWERINVERTER_FLUID and CASING. In the View panel, click Show to display the selected domains.
Show to display the selected domains.4. In the Properties panel, View tab, for Surface, set values for the options as listed below:
◦ Keep drawing—Yes
◦ Grid—No
◦ Outline—No
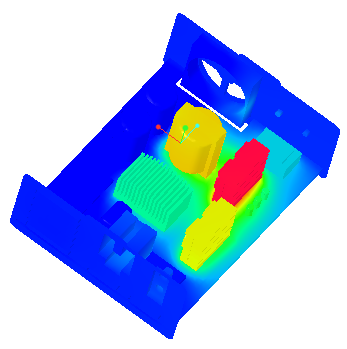
◦ Variable—Temperature: [K] : Heat
◦ Min—300
◦ Max—370
Plotting the Temperature at the Outlet Boundary
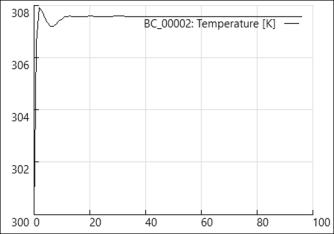
On X-axis: Iteration
On Y-axis: Temperature
1. In the Flow Analysis Tree, click > .
2. Select BC_00002.
3. Click XYPlot. A new entity xyplot1 appears in the Flow Analysis Tree under >
XYPlot. A new entity xyplot1 appears in the Flow Analysis Tree under > 4. Click xyplot1.
5. In the Properties panel, View tab, for Surface, set Variable to Temperature.
6. Click  Stop and
  Run in the Run group, if needed.
Stop and Run in the Run group, if needed.