Base Model Simulation Exercise 6—Analyzing Results
Plotting the Pressure at Monitoring Point
1. In the Flow Analysis Tree, under Boundary Conditions click General Boundaries.
2. Select Inlet.
3. Click  XYPlot. A new entity xyplot1 is added in the Flow Analysis Tree under > >
 XYPlot. A new entity xyplot1 is added in the Flow Analysis Tree under > >
 4. Select xyplot1.
5. In the Properties panel, set Variable—Pressure.
6. Click  Stop and
  Run, if required.
 Stop and
  Run, if required.
7. Click  XYPlot Panel to view the XY Plot.
 XYPlot Panel to view the XY Plot.
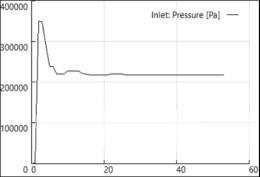
Since the gauge pressure at the outlet is set to 0 Pa, the pressure drop across the nozzle is equal to the inlet pressure as shown in the figure below.

Pressure Drop = 220000 Pa
On X-axis: Iteration
On Y-axis: Pressure