Power Inverter with Conjugate Heat Transfer: Exercise 6—Analyzing Results
This exercise describes how the results are analyzed during and after the simulation. To hide CAD surfaces (not the fluid domain), switch between  CAD Bodies and
  Flow Analysis Bodies.
CAD Bodies and Flow Analysis Bodies.Viewing the Pressure Contours on a Boundary
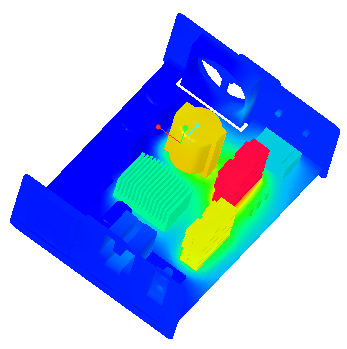 | Temperature: [K] : Heat 370.0  300.0 |
1. Select Domains.
2. In the  Turn on/off view properties list, click
  Hide all surfaces,
  Hide all grids, and
  Hide all outlines.
Turn on/off view properties list, click Hide all surfaces, Hide all grids, and Hide all outlines.3. Under Boundary Conditions, Interface, select all entities with a name beginning with POWERINVERTER_1_FLUID, PANEL_FAN_/POWERINVERTER_1_FLUID, and PANEL_SOCKET_/POWERINVERTER_1_FLUID.
4. In the Properties panel, View tab, for Surface, set values for the options as listed below:
◦ Keep drawing—Yes
◦ Grid—No
◦ Outline—No
◦ Variable—Temperature: [K] : Heat
◦ Min—300
◦ Max—370
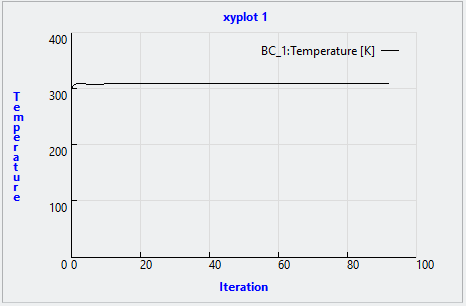
Plotting the Temperature at the Outlet Boundary
1. In the Flow Analysis Tree, click > .
2. Select BC_00001.
3. Click  XYPlot. A new entity xyplot1 appears in the Flow Analysis Tree under >
XYPlot. A new entity xyplot1 appears in the Flow Analysis Tree under > 4. Click xyplot1.
5. In the Properties panel, View tab, for Surface, set Variable to Temperature.
6. Click  Stop and
  Run in the Run group, if needed.
Stop and Run in the Run group, if needed.