Verification Cases—Static Structural Analyses
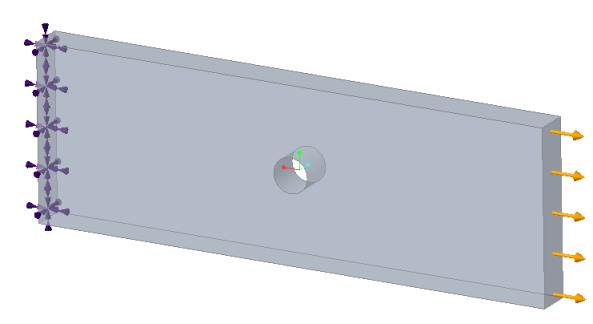
Rectangular Plate with Circular Hole Subjected to Tensile Loading
Problem Statement: A rectangular plate with a circular hole is fixed along one of the end-faces, and a tensile pressure load is applied on the opposite face. Find the maximum normal stress in the X- direction on the cylindrical surfaces of the hole.
References:
J. E. Shigley, Mechanical Engineering Design, McGraw-Hill, 1st Edition, 1986, Table A-23, Figure A-23-1, pg. 673
Material Properties | Geometric Properties | Loading |
|---|---|---|
Young’s modulus E = 1000 Pa Poisson’s ratio ν = 0.0 | Length = 15 m Width = 5 m Thickness = 1 m Hole radius = 0.5 m | Pressure = -100 Pa |
Result Comparison—Simulation quality slider at default position
Results | Target | Creo Simulate | Ansys Discovery Live | Creo Simulation Live | Percent Error |
|---|---|---|---|---|---|
Maximum Normal X Stress (Pa) | 312.5 | 313.272 | 270.69 | 265.11 | 15.16 |
Result Comparison—Simulation quality slider at maximum position
Results | Target | Creo Simulate | Ansys Discovery Live | Creo Simulation Live | Percent Error |
|---|---|---|---|---|---|
Maximum Normal X Stress (Pa) | 312.5 | 313.272 | 302.36 | 290.60 | 7.53 |
Results Comparison for Creo Ansys Simulation
(Default mesh resolution with face size = 0.15 m on hole surface and using the Curvature and proximity size function method)
Results | Target | Ansys AIM | Creo Ansys Simulation | Percent Error |
|---|---|---|---|---|
Maximum Normal X Stress (Pa) | 312.5 | 310.7 | 310.397 | 0.67 |
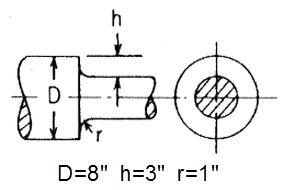
Stepped Shaft in Axial Tension
Problem Statement: Consider a stepped shaft under an applied axial load of 1000 psi on the smaller cross section of the shaft, compute the stress concentration based on the fillet radius at the step as shown below:
References:Roark’s Formulas for Stress and Strain, Warren C. Young and Richard G. Budynas,2002
Material Properties | Geometric Properties | Loading |
|---|---|---|
Young’s modulus E= 2.9008e7 psi Poisson’s ratio ν = 0.3 | D = 8 in h = 3 in r = 1 in | Pressure = -1000 psi |
Result Comparison—Simulation quality slider at default position
Results | Target | Creo Simulate | Ansys Discovery Live | Creo Simulation Live | Percent Error |
|---|---|---|---|---|---|
Maximum Normal Y Stress (psi) | 1376 | 1422.63 | 1526.5 | 1488 | 7.53 |
Results Comparison for Ansys AIM and Creo Ansys Simulation (Highest Mesh resolution)
Results | Target | Ansys AIM | Creo Ansys Simulation | Percent Error |
|---|---|---|---|---|
Maximum Normal Y Stress (psi) | 1376 | 1410.96 | 1466.68 | 6.18 |
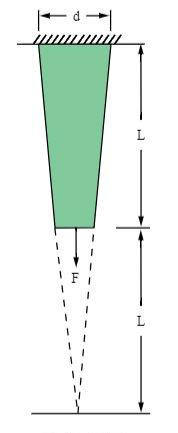
Elongation of a Solid Bar
Problem Statement: A tapered aluminum alloy bar of square cross-section and length L is suspended from a ceiling. An axial load F is applied to the free end of the bar. Determine the maximum axial deflection d in the bar and the axial stress σy at mid-length (Y = L/2).
References: C. O. Harris, Introduction to Stress Analysis, The Macmillan Co., New York, NY, 1959,pg. 237, problem 4
Material Properties | Geometric Properties | Loading |
|---|---|---|
Young’s modulus E=10.4e6 psi Poisson’s ratio ν = 0.3 | L = 10 in d = 2 in | F = 10000 lbf |
Result Comparison—Simulation quality slider at default position.
Results | Target | Creo Simulate | Ansys Discovery Live | Creo Simulation Live | Percent Error |
|---|---|---|---|---|---|
Directional Deformation Y (in) | 0.0048077 | 0.0048156 | 0.0048 | 0.0048 | 0.15 |
Normal Stress Y at L/2 (psi) | 4444 | 4439.45 | 4446.2 | 4415.46 | 0.65 |
Results Comparison for Ansys AIM and Creo Ansys Simulation (Default mesh)
Results | Target | Ansys AIM | Creo Ansys Simulation | Percent Error |
|---|---|---|---|---|
Directional Deformation Y (in) | 0.0048077 | 0.0048266 | 0.0048266 | 0.39 |
Normal Stress Y at L/2 (psi) | 4444 | 4443.1 | 4582 | 3.01 |
Circular Plate under Uniform Pressure
Problem Statement: Consider a circular plate with fixed edges under a uniformly distributed pressure load. Find the maximum deflection in the centre of the plate.
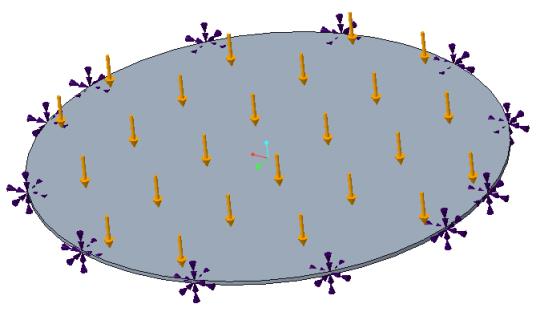
References: R. J. Roark, W. C. Young,Formulas for Stress and Strain, McGraw-Hill Book Co., Inc.,New York, NY, 1975, Table 24.
Material Properties | Geometric Properties | Loading |
|---|---|---|
Young’s modulus E= 30e6 psi Poisson’s ratio ν = 0.3 | Diameter = 30 in Thickness = 0.25 in | P = 3 psi |
Results—Simulation quality slider at default position
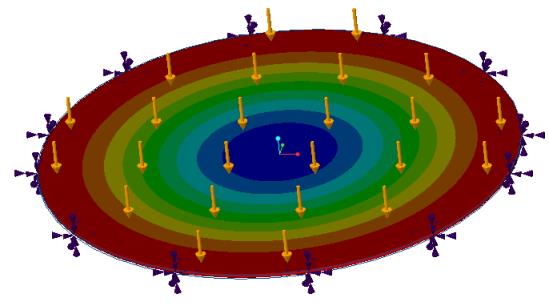
Result Comparison—Simulation quality slider at maximum position for an M2000 graphics card
Results | Target | Creo Simulate | Ansys Discovery Live | Creo Simulation Live | Percent Error |
|---|---|---|---|---|---|
Deflection centre of plate, in. | 0.0553 | 0.0549 | 0.0546 | 0.0545 | 1.47 |
Result Comparison—Simulation quality slider at maximum position for a P4000 graphics card
Results | Target | Creo Simulate | Ansys Discovery Live | Creo Simulation Live | Percent Error |
|---|---|---|---|---|---|
Deflection centre of plate (in.) | 0.0553 | 0.0549 | 0.0590 | 0.0527 | 4.93 |
Results Comparison for Creo Ansys Simulation (Highest Mesh resolution)
Results | Target | Ansys AIM | Creo Ansys Simulation | Percent Error |
|---|---|---|---|---|
Deflection center of plate, (in) | 0.0553 | 0.05505 | 0.05505 | 0.45 |