Benchmark Cases
The following benchmark cases compare results of specific problems for Ansys Discovery Live and Creo Simulation Live. All the benchmark cases for Creo Simulation Live are run on a machine with an NVIDIA Quadro P4000 graphics card.
For each case, a second table compares the results of these problems for Ansys AIM and Creo Ansys Simulation.
Modal Analysis of a Robot Arm
Problem Statement: Consider a steel robot arm assembly with a fixed base. Calculate the first three natural frequencies and mode shapes of the assembly.
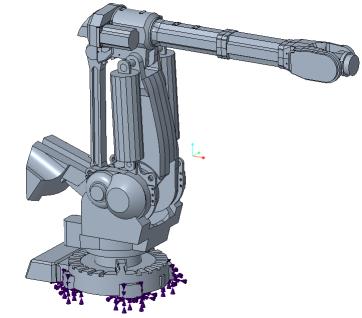
Material Properties | Boundary Conditions |
|---|---|
Young’s modulus E = 2e11 Pa Poisson’s ratio ν = 0.3 | Fixed support |
Results—Simulation quality slider at maximum position
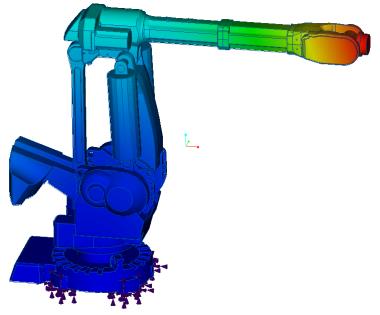
Results | Ansys Discovery Live | Creo Simulation Live | Percent Difference |
|---|---|---|---|
Mode 1 Frequency, Hz | 17.26 | 18.6 | 7.2 |
Mode 2 Frequency, Hz | 23.84 | 24.1 | 1.1 |
Mode 3 Frequency, Hz | 34.68 | 35.7 | 2.8 |
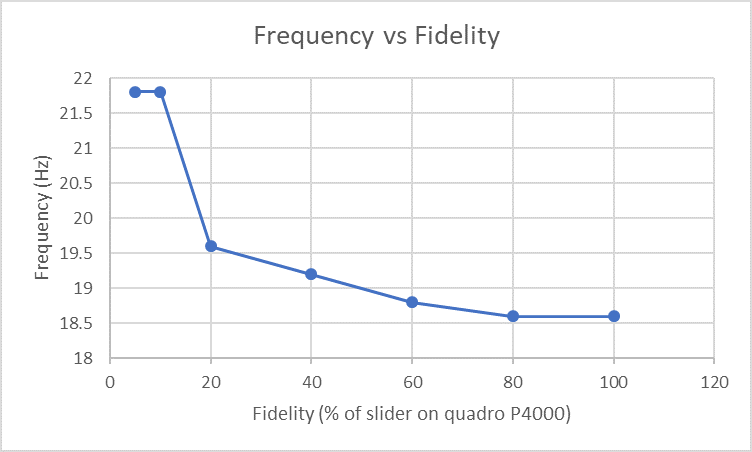
The following graph shows the convergence of Mode 1 vs the value of the simulation quality slider (fidelity):
Results—Simulation quality slider at default position
Results | Ansys Discovery Live | Creo Simulation Live | Percent Difference |
|---|---|---|---|
Mode 1 Frequency, Hz | 19.23 | 18.9 | 1.7 |
Mode 2 Frequency, Hz | 24.67 | 24.5 | 0.7 |
Mode 3 Frequency, Hz | 37.33 | 37.0 | 0.9 |
Results Comparison for Creo Ansys Simulation (highest mesh resolution)
Results | Ansys AIM | Creo Ansys Simulation | Percent Error |
|---|---|---|---|
Mode 1 Frequency, Hz | 15.8 | 15.65 | 0.95 |
Mode 2 Frequency, Hz | 21.7 | 21.05 | 3.08 |
Mode 3 Frequency, Hz | 31.6 | 29.88 | 5.75 |
Modal Analysis of a Printed Circuit Board
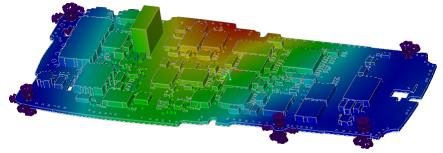
Problem Statement: Consider a printed circuit board assembly with fixed supports. The PCB is made of FR4 and all other components are assumed to have the properties of epoxy. Calculate the first three natural frequencies and mode shapes of the printed circuit board assembly.
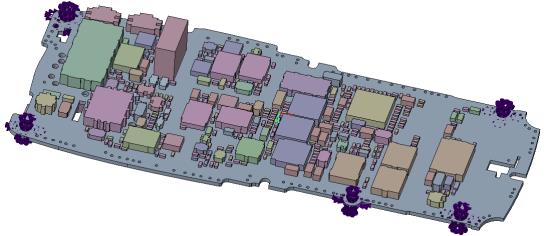
Material Properties | Boundary Conditions |
|---|---|
FR4 Young’s modulus E = 1.1e10 Pa Density ⍴= 1900 kg/m3 Poisson’s ratio ν= 0.28 Epoxy Young’s modulus E = 1.1e9 Pa Density ⍴ = 950 kg/m Poisson’s ratio ν = 0.42 | Fixed support on five support holes as shown in the figure below. |
Result Comparison—Simulation quality slider at maximum position
Results | Ansys Discovery Live | Creo Simulation Live | Percent Difference |
|---|---|---|---|
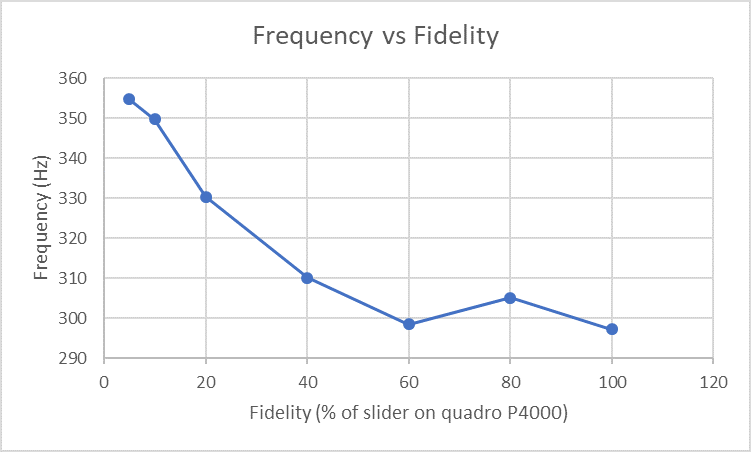
Mode 1 Frequency, Hz | 299.34 | 297.2 | 0.72 |
Mode 2 Frequency, Hz | 611.07 | 607.1 | 0.65 |
Mode 3 Frequency, Hz | 815.31 | 807.3 | 0.99 |
The following graph shows the convergence of of Mode 1 vs the resolution size
Result Comparison—Simulation quality slider at default position
Results | Ansys Discovery Live | Creo Simulation Live | Percent Difference |
|---|---|---|---|
Mode 1 Frequency, Hz | 326.5 | 330.9 | 1.33 |
Mode 2 Frequency, Hz | 670.9 | 674.2 | 0.49 |
Mode 3 Frequency, Hz | 905.24 | 908.8 | 0.39 |
Static Loading of a Bracket
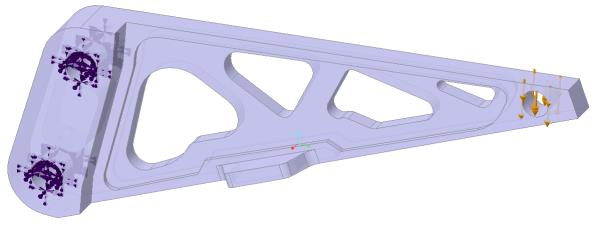
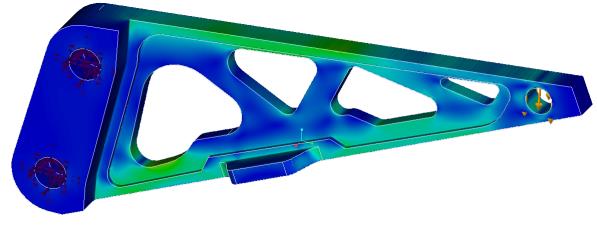
Problem Statement: Consider the static loading of an aluminium bracket. The loading consists of an applied load of 200 N and two fixed supports. Calculate the maximum tip displacement and maximum equivalent stress in the rear cut-out of the part as a function of the position of the Fidelity slider in both Discovery Live and Creo Simulation Live.
Material Properties | Boundary Conditions | Loading |
|---|---|---|
Young’s modulus E = 7.1 E10 Pa Density ⍴= 1900 kg/m3 Poisson’s ratio ν= 0.33 | Two fixed supports as shown in the figure above | 200N as shown in the figure above. |
Results—Tip Displacement with the simulation quality slider at the maximum position.
Fidelity Slider Position (Percentage) | Displacement—m Ansys Discovery Live | Displacement—m Creo Simulation Live | Percent Difference |
|---|---|---|---|
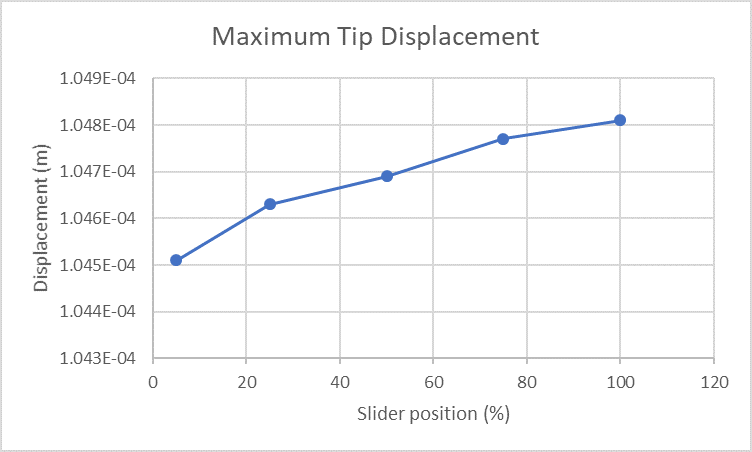
0 | 1.014E-04 | 1.045E-04 | 2.9 |
25 | 1.079E-04 | 1.046E-04 | 3.100 |
50 | 1.073E-04 | 1.047E-04 | 2.500 |
75 | 1.064E-04 | 1.048E-04 | 1.600 |
100 | 1.054E-04 | 1.048E-04 | 0.600 |
The following is a graph of the maximum tip displacement with the simulation quality slider at different positions
Results—Equivalent Stress in the rear cut-out with the simulation quality slider at different position.
Fidelity Slider Position (Percentage) | Stress MPa Ansys Discovery Live | Stress MPa Creo Simulation Live | Percent Difference |
|---|---|---|---|
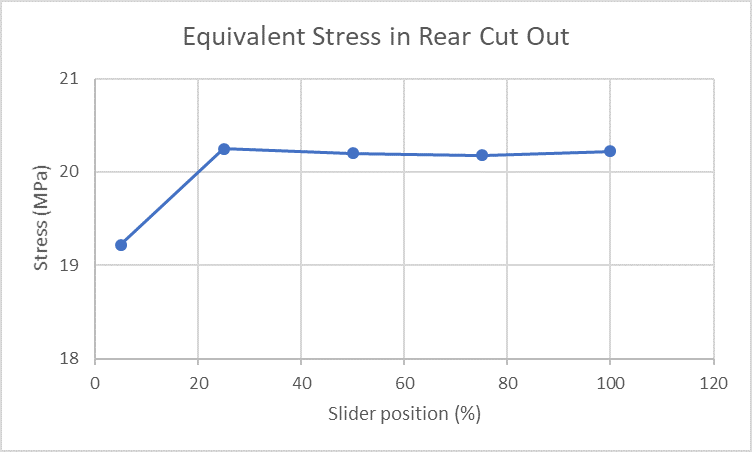
5 | 16.74 | 19.22 | 12.92 |
25 | 18.51 | 20.25 | 8.64 |
50 | 21.51 | 20.20 | 6.48 |
75 | 18.75 | 20.18 | 7.13 |
100 | 20.69 | 20.21 | 2.51 |
The following is a graph of the equivalent stress in the rear cut out with the simulation quality slider at different positions
Results Comparison for Creo Ansys Simulation (Highest mesh resolution)
Results | Ansys AIM | Creo Ansys Simulation | Percent Error |
|---|---|---|---|
Max Displacement, m | 0.11008E-3 | 0.11008E-3 | 0 |
Max Equivalent Stress, MPa | 18.46 | 17.39 | 6.15 |
Static Loading of a Rocker Arm Assembly
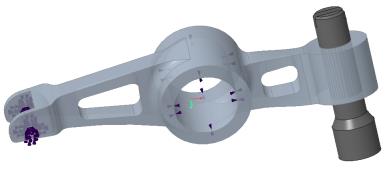
Problem Statement: Consider the static loading of a rocker arm assembly with variable fillet radii. The loading consists of an applied load of 600 N, a frictionless and a fixed support. Calculate the maximum equivalent stress.
Boundary Conditions | Loading |
|---|---|
1–Frictionless constraint 2–Fixed support | 600 N as shown in the figure |
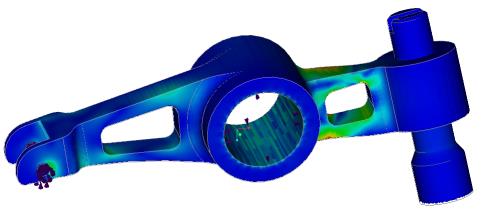
Results for maximum equivalent stress with the simulation quality slider at the maximum position
Stress MPa Ansys Discovery Live | Stress MPa Creo Simulation Live | Percent Difference |
|---|---|---|
128.77 | 130.392 | 1.24 |
Results Comparison for Creo Ansys Simulation (Highest mesh resolution)
Stress MPa—Ansys AIM | Stress MPa—Creo Ansys Simulation | Percent Error |
|---|---|---|
123.89 | 127.59 | 2.89 |
Heat Transfer in a Package/Heat Sink Assembly
Problem Statement: Consider the steady-state heat transfer of an aluminium heat sink, thermal interface layer and package assembly. The package generates 5 Watts of power and the outer surfaces of the heat sink have a convection boundary condition with a heat transfer coefficient of 5 W/m^2 degree C and fluid bulk temperature of 20 degree C. Calculate the maximum temperature in the aluminium heat sink and the maximum temperature in the assembly for a steady-state condition.
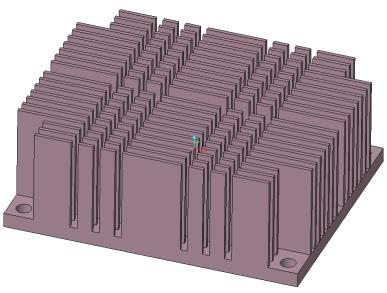
Material Properties | Boundary Conditions |
|---|---|
Aluminium, K = 148.62 W/m degree C TIM, K = 24 W/m degree C Package, K = 2 W/m degree C | Package Heat Flow = 5 W Heat Transfer Coefficient = 5 W/m^2 degree C Fluid Bulk Temperature = 20 degree C |
Results —Max Temperature with the simulation quality slider at default position
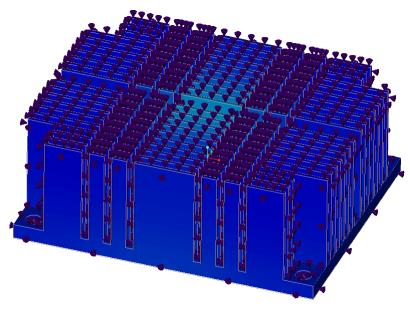 | 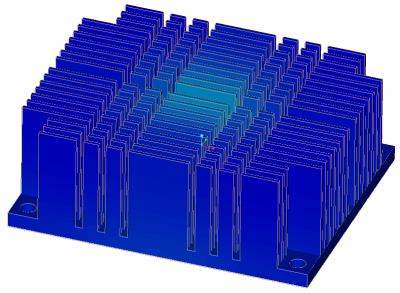 |
Results —Max Temperature with the simulation quality slider at default position | Results —Max Temperature with the simulation quality slider at default position |
Results —Max Temperature with the simulation quality slider at default position
Results | Ansys Discovery Live | Creo Simulation Live | Percent Difference |
|---|---|---|---|
Max Temperature Heat Sink, C | 39.83 | 39.26 | 1.45 |
Max Temperature, C | 53.92 | 55.11 | 2.16 |
Results —Max Temperature with the simulation quality slider at maximum position
Results | Ansys Discovery Live | Creo Simulation Live | Percent Difference |
|---|---|---|---|
Max Temperature Heat Sink, C | 40.01 | 39.58 | 1.09 |
Max Temperature, C | 54.5 | 53.90 | 1.11 |
Results Comparison for Creo Ansys Simulation (Default mesh resolution)
Results | Ansys AIM | Creo Ansys Simulation | Percent Error |
|---|---|---|---|
Max Temperature Heat Sink, C | 42.6 | 42.6 | 0 |
Max Temperature, C | 54.0 | 56.5 | 4.42 |