View Simulation Results
Use simulation view options to visualize the Von Mises Stress and Displacement on the optimized model. To perform higher fidelity FEA on the optimized model, select the Perform final simulation pass check box in the Generative Design Options dialog box. This gives you approximate FEA results. For more accurate results, it is recommended to run the FEA in the Simulation application.
To View Simulation Results
Click  Display Simulation Results or click in the graphics toolbar to view the simulation results as an FEA fringe plot on the generative design feature. Make sure that
  Display Generative Result is selected in the graphics toolbar to view the results in the graphics window.
Display Simulation Results or click in the graphics toolbar to view the simulation results as an FEA fringe plot on the generative design feature. Make sure that Display Generative Result is selected in the graphics toolbar to view the results in the graphics window.Legend
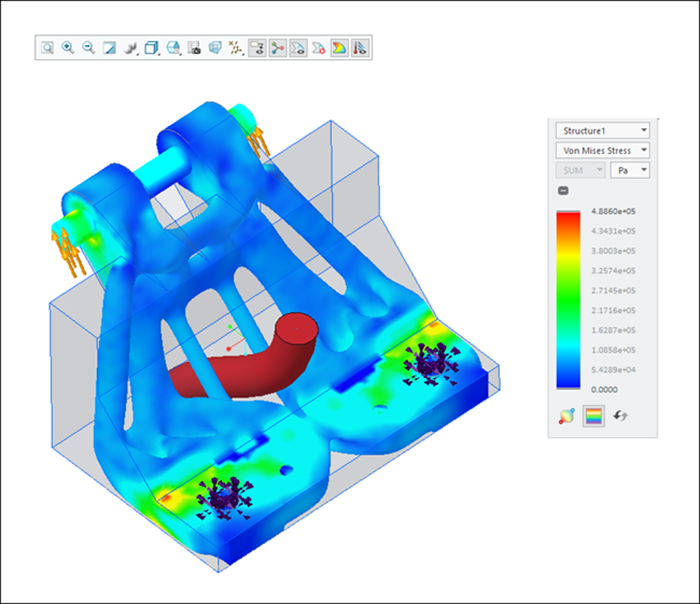
When you click Display Simulation Results, a legend widget appears along with the FEA fringe plot. The legend widget maps the colors on the fringe plot with the numerical values of the plotted field.
Display Simulation Results, a legend widget appears along with the FEA fringe plot. The legend widget maps the colors on the fringe plot with the numerical values of the plotted field.The following image shows the Von Mises Stress fringe plot on the model.
From the legend widget you can do the following:
• Select a load case and view the Von Mises Stress or Displacement fringe plot on the model.
• Click  to switch between viewing the results as distinct color bands or diffused colors.
to switch between viewing the results as distinct color bands or diffused colors.• Click  to view the locations with maximum and minimum values of the plotted field.
to view the locations with maximum and minimum values of the plotted field.• Pull the top edge of the legend downward to change the range of the maximum result value displayed in the model. Click to edit the maximum value for the displayed range.
• Pull the bottom edge of the legend upward to change the range of the minimum result value displayed in the model. Click to edit the minimum value for the displayed range.
To Animate Model Deformations
1. Click  Animate Deformation. The Animation Deformation Settings dialog box opens.
Animate Deformation. The Animation Deformation Settings dialog box opens.2. Move the Speed and Scale sliders to change the animation speed and scale.
The generative_animation_speed and generative_animation_scaleconfiguration options set the animation speed and scale for the FEA deformation. Click Reset to reset the speed and scale values to the default. |
3. Click  to play and click
  to stop the animation.
to play and click to stop the animation.4. Click Close to close the Animation Deformation Settings dialog box.
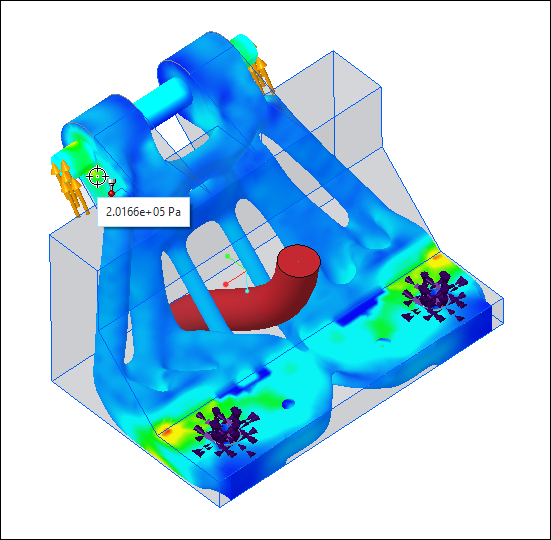
To Run Simulation Probe
Use the simulation probe tool to display the value of the displayed result quantity at a particular point. To display the numerical value of the plotted field, move the pointer over the calculated fringe plot.
The following image shows the numerical value of the Von Mises Stress at the location of the pointer.