Querying and Saving Results in Creo Simulation Live
There are two methods of querying result data in Creo Simulation Live:
Simulation Query
Click >  Simulation Query to run a simulation query. A simulation query is used to view the value of the quantity selected from the Results legend at any point on the model. As you move the pointer and click different points on the model, the value of the result quantity at the point is updated. Change the quantity from the Results legend to change the quantity queried on the model.
Simulation Query to run a simulation query. A simulation query is used to view the value of the quantity selected from the Results legend at any point on the model. As you move the pointer and click different points on the model, the value of the result quantity at the point is updated. Change the quantity from the Results legend to change the quantity queried on the model.Running a Simulation Query
For a Live Simulation study carry out the following steps:
1. Select the quantity that you want to query from the Results legend.
2. Click > Simulation Query to open the Simulation Query dialog box.
Simulation Query to open the Simulation Query dialog box.3. Click any point on the model in the Graphics Window to view the value of the result quantity at that point.
You can view the value of a result quantity at any point on the model.
4. Click Save if you want to create a simulation probe for the selected quantity at the selected point.
If you don’t save the query as a probe, the query is lost when you close the Simulation Query dialog box.
Simulation Probe
Use the simulation probe to view and save result quantities for a simulation study. You can create simulation probes to view the following:
• Value of a selected result quantity for a particular point, surface, body, part or assembly, along with the selected reference on your model.
In addition to result quantities displayed in the legend you can create probes for additional result quantities that you want to view.
• Maximum value of a result quantity for selected surfaces, bodies, parts, assemblies, or sub-assemblies in a model.
• Minimum value of a result quantity for selected eligible surfaces, bodies, parts, assemblies, or sub-assemblies in a model.
• Average value of a result quantity for selected surfaces, bodies, parts, assemblies, or sub-assemblies in a model.
Note that when you select multiple references for maximum, minimum, or average value type of probes, only the valid result values are used in the calculation of the resultant probe value. If you select a reference for which the quantity is not valid (not calculated) then that value is ignored when displaying the probed value. For example, you have a multibody part with one fluid and one solid domain and when creating a probe for average velocity you select one surface from the solid domain and one from the fluid domain. The velocity for the surface on the solid domain is not valid and so not calculated and so the average value displayed will be just the value of the surface on the fluid domain. |
• Graphs of time varying results.
• Result History for structure, modal, steady-state thermal or steady-state flow studies.
You can create multiple probes for different quantities in a single simulation study. After you create a probe you can save it with the model. You can create a probe before or after running a study.
To Create a Simulation Probe
1. Click  Simulation Probe to open the Simulation Probe dialog box.
Simulation Probe to open the Simulation Probe dialog box.2. Type a name for the probe or accept the default name.
3. Select a result type from the Results Type list. By default, the result quantity that is selected in the Results legend is selected.
4. Select one of the following types of results:
◦ Value at Point—View the result quantity at a point along with the coordinates of the point.
◦ Minimum—View the minimum value of the result quantity for a selected surface, body, part, assembly, or sub-assembly in a model.
◦ Maximum—View the maximum value of the result quantity for a selected surface, body, part, assembly, or sub-assembly in a model.
◦ Average—View the average value of the result quantity for a selected surface, body, part, assembly, or sub-assembly in a model.
5. Select the geometry for which you want to query the result quantity. The selected point, surface, part, assembly or sub-assembly appears in the References collector.
Hold the CTRL key to select multiple references of the same type. For example, if you select one surface, then you can hold the CTRL key and select more surfaces. You can also create a probe for the maximum or minimum value of the top model.
For a simplified lattice you cannot create probes because you cannot select geometry for a simplified lattice. |
6. Click  Details to view the details of the probe, such as the name of the simulation study, the coordinates of the selected point along with the result quantity, or the maximum, minimum, or average value of the result quantity for a selected surface, body, or part.
Details to view the details of the probe, such as the name of the simulation study, the coordinates of the selected point along with the result quantity, or the maximum, minimum, or average value of the result quantity for a selected surface, body, or part.Click  to minimize the probe.
to minimize the probe.7. Click OK to save the probe. The probe is added to the Model Tree under a node “Probes”. It is also displayed in the Graphics Window on the model.
8. For time varying results, such as the results of transient thermal studies or fluid simulation studies click  to view a time dependent graph of the selected quantity for the point or surface.
to view a time dependent graph of the selected quantity for the point or surface.Click  to minimize the display of the graph.
to minimize the display of the graph.9. Probes are also saved as analyses in the model, and can be retrieved by the following methods:
◦ Click >  Saved Analysis.
Saved Analysis.◦ Click > > Saved Analysis.
Saved Analysis.Displaying Result History using Probes
For structure, modal and steady-state thermal and flow studies you can view a basic bar graph of result quantities that vary as a result of input conditions. The X- axis of the graph represents each change in the result quantity, while the Y- axis displays a result quantity. To create and view a basic result history graph perform the following steps:
1. Set up a live simulation study.
2. Create a probe for the study.
3. Save the probe. The probe is displayed in the Model Tree and in the graphics window.
4. Click the arrow next to Query on the Query group, and select the Accumulate Data check box.
5. The button is now available on the saved probe in the graphics window.
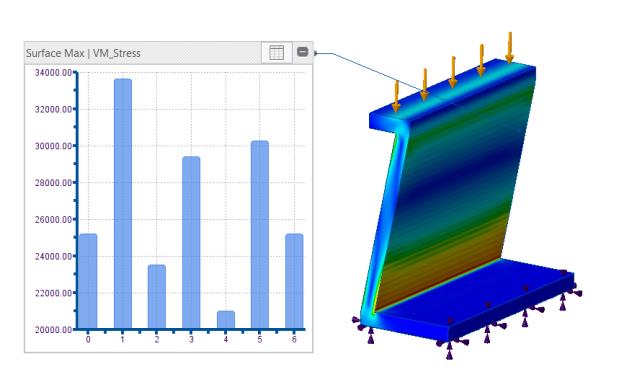
button is now available on the saved probe in the graphics window.6. Click to view the result history for the probed result quantity. For every change in input conditions or geometry, the graph changes.
to view the result history for the probed result quantity. For every change in input conditions or geometry, the graph changes.The following example shows the values of Von Mises stress at a point on the model for different loads. The X- axis represents each change in the result on account of load changes. The Y-axis shows Von Mises stress at a point on the model for each load change.
You can right-click the graph and select Export to Excel or Export to TXT to save the chart values in a spreadsheet or a text file.
By default the Accumulate Data check box is cleared and the graph button is not available on the probe.
is not available on the probe.