Saving Views and Generating Reports
The Stackup analysis report generated in .html format contains the model snapshots, stackup notes stackup results, and graphs. Follow the steps to prepare the model and generate a report. Steps 1 through 3 are optional.
Step 1: Moving Dimensions
You can adjust the position of the stackup dimensions to improve the presentation for the report images. Follow the steps to move the dimensions:
1. Click > . The Move Dimensions dialog box opens.
2. Click the dimension in the graphics window, move the pointer, and click again to place the dimension at a new location.
Step 2: Saving Model Snapshots
You can save the model orientation and zoom to be used in the report images. Follow the steps to save the snapshot:
1. Orient the model in the graphics window.
2. Click  in the Summary of 1D Tolerance Stackups table. The model view snapshot is saved. This snapshot shows nominal values of all Stackups.
in the Summary of 1D Tolerance Stackups table. The model view snapshot is saved. This snapshot shows nominal values of all Stackups.3. To save a snapshot of an individual Stackup, click  to open the Stackup Details table and repeat the steps 1–2.
to open the Stackup Details table and repeat the steps 1–2.The snapshots are saved and used in all reports that you generate. Save a new snapshot to replace the existing one. To view the saved orientation, click  in the Summary of 1D Tolerance Stackups table or Stackup Details Table. in the Summary of 1D Tolerance Stackups table or Stackup Details Table. |
Step 3: Adding Stackup Notes
You can add a note to a stackup to provide a brief description of the stackup to appear in the report. Follow the steps below for the basic workflow. See Creating Stackup Notes for additional details.
1. From the Stackup Details table for a selected stackup, click the Notes tab at the bottom of the window.
2. Type the note into the text area.
Step 4: Generating reports
1. Click > . The Generate Report dialog opens.
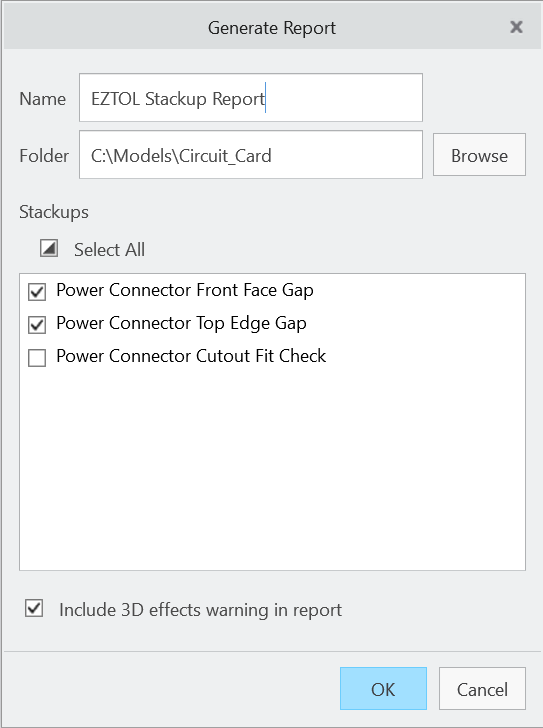
2. Specify the name of the report and the location on your local drive where the report files should be saved.
3. You can choose which stackups to be included in the report by selecting the checkboxes next to the stackup names.
4. You can also choose to disable the warning about 3D effects from appearing in the report. When disabled, the warning glyph is not shown next to the Pass or Fail icons in the summary table, and the warning message is not shown below the results graphs. For more information about the 3D effects warning, see Common Error and Warning Messages.
5. Click OK. The report is saved and opens in your default browser.