Viewing Global Results
Viewing Global Results
Global results are calculated for every study that is run. When a study run completes, global results are available and can be viewed in the Graphics Window using one of the following methods:.
• Click > to display the results on the model in the Graphics Window.
• From the Simulation Tree, select > . Right-click  to activate the results. The results are shown on the model in the Graphics Window.
to activate the results. The results are shown on the model in the Graphics Window.Select the global result quantity you want to view from the results legend.
Results Mini Toolbar

Global results are displayed along with a mini toolbar that contains the following commands:.
•  —Used as a handle to drag and reposition the mini toolbar anywhere in the Graphics Window.
—Used as a handle to drag and reposition the mini toolbar anywhere in the Graphics Window.•  —Opens the Substep Results control. Move the slider to view the results at different substeps. Alternatively type the substep for which you want to view the results.
—Opens the Substep Results control. Move the slider to view the results at different substeps. Alternatively type the substep for which you want to view the results.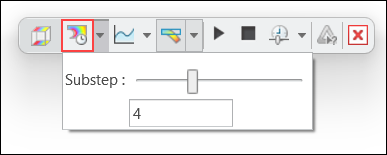
• Click  Minimum Chart and Maximum Chart to view graphs of the minimum and maximum values of the result quantity at different substeps.
Minimum Chart and Maximum Chart to view graphs of the minimum and maximum values of the result quantity at different substeps.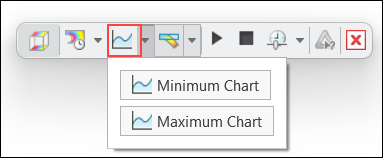
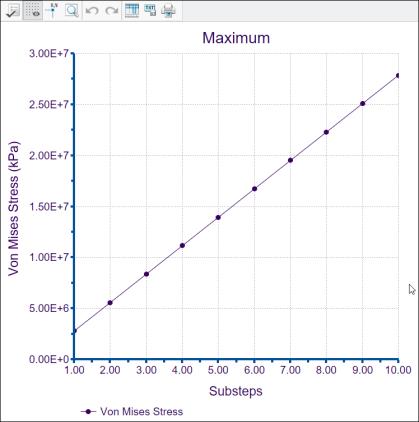
The following figure shows the maxiumum value of Von Mises stress at 10 different substeps.
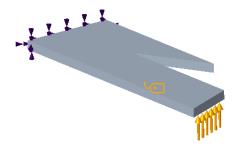
•  Toggles between displaying deformed or undeformed results. By default deformed results are displayed.
Toggles between displaying deformed or undeformed results. By default deformed results are displayed.다음 그림에서는 변형되지 않은 결과와 서로 다른 값으로 크기 조정된 변형된 결과가 표시되는 방법을 보여줍니다.
모델 | 변형되지 않은 결과 | 자동 크기 조정 = 1로 변형된 결과 | 자동 크기 조정 = 5로 변형된 결과 |
|---|---|---|---|
 | 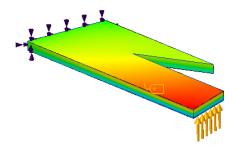 | 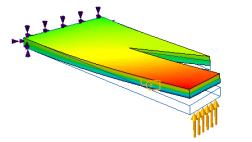 | 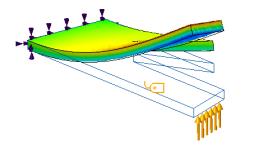 |
을 누르면 다음 추가 옵션을 사용할 수 있습니다.◦ 자동 크기 조정(Autoscale) - 기본 옵션입니다. 변형된 결과에 대한 배율 계수로 인접 목록에서 고정 값을 선택합니다.
◦ 변형 배율(Deformation Scale) - 양의 실수를 변형된 결과에 대한 배율 계수로 지정합니다. 여기서 값 1은 배율 조정이 없거나 결과가 true임을 나타냅니다.
• The following options control the display of animated results:
◦  Start—Starts animation of deformation results.
Start—Starts animation of deformation results.◦  Pause—Pauses the animation of deformation results.
Pause—Pauses the animation of deformation results.◦  Stop—Stops the animation of deformation results.
Stop—Stops the animation of deformation results.◦  Speed—Changes the speed of animation.
Speed—Changes the speed of animation.•  —Creates a simulation query that allows you to view the results at a point. The simulation query is only available for undeformed results.
—Creates a simulation query that allows you to view the results at a point. The simulation query is only available for undeformed results.•  —Stops displaying the results.
—Stops displaying the results.Parent topic