Defining Results—Creo Ansys Simulation
In addition to the global result quantities that are available for every simulation study that runs, you can also define and save the following results for simulation studies:
User-defined results are created for specific references in your model. You can hide a component from the Model Tree or the Graphics Window using the  command. However the contour and vector plot results are displayed on the hidden component.
command. However the contour and vector plot results are displayed on the hidden component.Contour Plots
You can use a contour plot to visualize and assess gradients for result quantities displayed on a surface or volume. Different color bands represent different values of the result quantity.
To create a contour plot for a result quantity, perform the following steps:
1. Click > to open the Contour Plot dialog box.
2. Select references at which you want to study a result. Valid references are models, bodies, surfaces, edges or datum planes. You can select mixed references but you cannot select any other reference along with a datum plane. Use the Selection Filter at the bottom right of the window to filter a particular geometry. This makes it easier to select multiple references for larger and more complex models.
For non-geometry references such as contacts, idealizations, or joints, all the available references are automatically available in the References collector. Select the reference at which you want to create a result.
3. Select a result from the Results type list, which shows the commonly used results. Click Other if you want to select other results.
4. Optionally, clear or select the Use nodal averaging check box.
 |  |
Select the Use nodal averaging check box to display continuous contours across element boundaries, as the value of the result is averaged at each node. Adjacent elements show a smooth color transition. | Clear the Use nodal averaging check box to display gradients across adjacent elements. The contours are discontinuous across element boundaries. Adjacent elements show a sharper difference in colors. |
This check box is only available for stresses, strains, and contact results for structural studies, and heat flux and temperature gradients in the case of thermal studies.
5. Click OK to create the result. The result is displayed in the Simulation Tree.
Vector Plots
You can use vector plots to display result quantities such as displacement, force reaction, or heat flux that display both direction and magnitude. Vector plots are used to display the directional behavior of a quantity by superimposing sets of colored arrows over a transparent view of your model. The range of a quantity is represented by a specific color. The length and color of the arrow denote the magnitude of the directional forces. The vectors help you visualize the direction of changing quantities.
To create a vector plot result perform the following steps:
1. Click > to open the Vector Plot dialog box.
2. Select references at which you want to study a result. Valid references are models, bodies, surfaces, edges or datum planes. You can select mixed references but you cannot select any other reference along with a datum plane. Use the Selection Filter at the bottom right of the window to filter a particular geometry. This makes it easier to select multiple references for larger and more complex models.
For non-geometry references such as contacts, idealizations, or joints, all the available references are automatically available in the References collector. Select the reference at which you want to create a result.
3. Select a result from the Results type list.
4. Click OK to create the result.
Results Mini Toolbar

User-defined results are displayed along with a mini toolbar that contains the following commands:
•  —Indicates that the results are user—defined results. Also used as a handle to drag and reposition the mini toolbar anywhere in the Graphics Window.
—Indicates that the results are user—defined results. Also used as a handle to drag and reposition the mini toolbar anywhere in the Graphics Window.•  —Opens the Substep Results control. Move the slider to view the results at different substeps. Alternatively type the substep for which you want to view the results.
—Opens the Substep Results control. Move the slider to view the results at different substeps. Alternatively type the substep for which you want to view the results.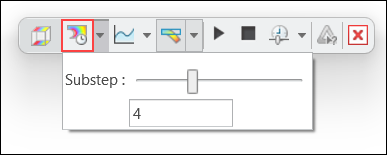
• Click  Minimum Chart and Maximum Chart to view graphs of the minimum and maximum values of the result quantity at different substeps.
Minimum Chart and Maximum Chart to view graphs of the minimum and maximum values of the result quantity at different substeps.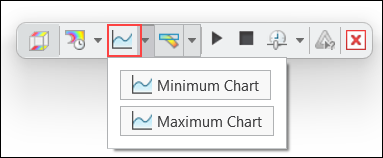
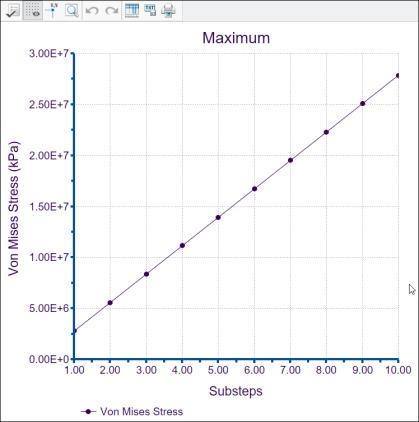
The following figure shows the maxiumum value of Von Mises stress at 10 different substeps.
•  —Toggles between displaying deformed or undeformed results. By default deformed results are displayed.
—Toggles between displaying deformed or undeformed results. By default deformed results are displayed.La figure suivante montre comment les résultats non déformés et les résultats déformés qui sont mis à l'échelle avec des valeurs différentes s'affichent.
Modèle | Résultats non déformés | Résultats déformés avec Echelle automatique (Autoscale) = 1 | Résultats déformés avec Echelle automatique (Autoscale) = 5 |
|---|---|---|---|
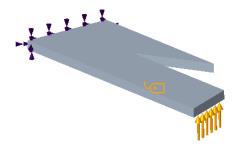 | 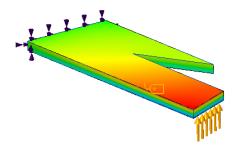 | 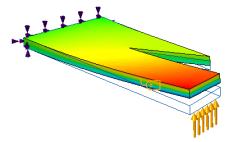 | 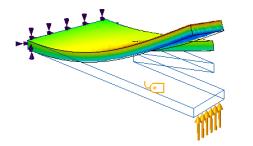 |
Lorsque l'utilisateur appuie sur , les options supplémentaires suivantes sont disponibles :
, les options supplémentaires suivantes sont disponibles :◦ Echelle automatique (Autoscale) : option par défaut. Sélectionnez une valeur fixe dans la liste adjacente en tant que facteur d'échelle pour les résultats déformés.
◦ Echelle de déformation (Deformation Scale) : spécifiez un nombre réel positif comme facteur d'échelle pour les résultats déformés, où la valeur 1 indique l'absence de mise à l'échelle ou un résultat vrai.
• The following options control the display of animated results:
◦  Start—Starts animation of deformation results.
Start—Starts animation of deformation results.◦  Pause—Pauses the animation of deformation results.
Pause—Pauses the animation of deformation results.◦  Stop—Stops the animation of deformation results.
Stop—Stops the animation of deformation results.◦  Speed—Changes the speed of animation.
Speed—Changes the speed of animation.•  —Creates a simulation query that allows you to view the results at a point. The simulation query is only available for undeformed results.
—Creates a simulation query that allows you to view the results at a point. The simulation query is only available for undeformed results.•  —Stops displaying the results and returns to the Creo Ansys Simulation application.
—Stops displaying the results and returns to the Creo Ansys Simulation application.Updating Results
If you add a user defined result or a simulation probe to a study after the simulation study run has completed the results show a status of not evaluated ( ) in the Simulation Tree. Right-click Results in the Simulation Tree and click
  Update Results to evaluate the newly added user defined results.
) in the Simulation Tree. Right-click Results in the Simulation Tree and click Update Results to evaluate the newly added user defined results.When you run the Update Results command all results and probes for the active study are evaluated and updated. |
Parent topic