EZ Tolerance Analysis Enhancement: Analysis Results Plot Includes All Quality Metrics
Creo Parametric 10.0.0.0
User Interface Location: > tab.
Videos
Description
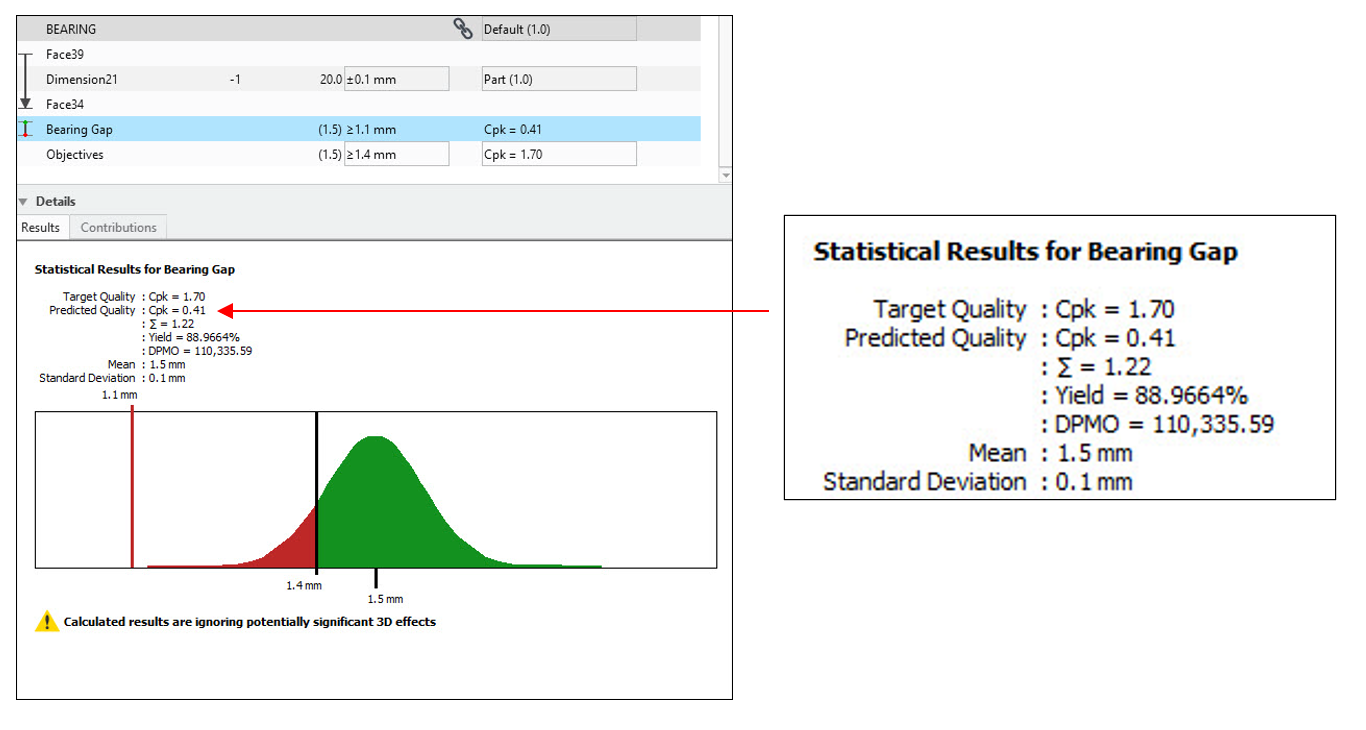
In some scenarios, for reference, you may need to see other quality metrics that are not being used for the stackup analysis plot.
The stackup analysis results plot is always calculated based on a single chosen quality metric. Now it also includes all other quality metrics for reference (Cpk, Sigma, DPMO, %Yield).
Benefits
You can access valuable analysis information in the results plot in stackup reports.
Additional Information
Tips: | None. |
Limitations: | No known limitations. |
Does this replace existing functionality? | No. |
Configuration option associated with this functionality: | None. |