Multicomponent Mixing using a Nozzle: Exercise 8—Analyzing Results
This exercise describes how you analyze the results during and after the simulation. To hide CAD surfaces (not the fluid domain), switch between  Flow Analysis Bodies and
  CAD Bodies in the Show group. Clear any variable display by selecting No Selection in the Legend drop-down. Click
  XYPlot Panel to view the XY Plot.
Flow Analysis Bodies and CAD Bodies in the Show group. Clear any variable display by selecting No Selection in the Legend drop-down. Click XYPlot Panel to view the XY Plot.1. To show/hide selected geometric entities, click  Show in View Panel. Show in View Panel.2. To change the color scheme, click on  More in the Legend and select between Blue Red and Blue Purple. More in the Legend and select between Blue Red and Blue Purple. |
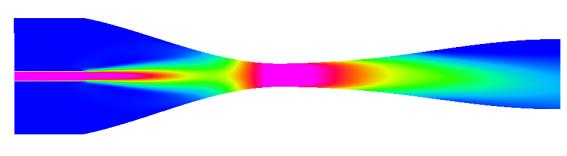
Viewing the Velocity Contours on Sections
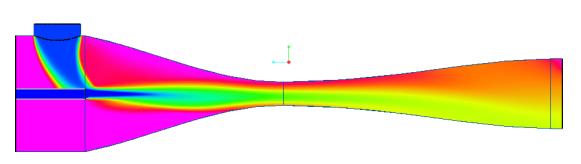
1. Create sections Section 01. It appears under Derived Surfaces.
2. Select Section 01. In the Properties panel, Model tab, set values for the options as listed below:
◦ Type — Plane X
◦ Position — 0.0555
3. In the Properties panel, View tab, for Surface, set values for the options as listed below:
◦ Grid — No
◦ Outline — No
◦ Variable — Concentration:CH4 [-] : Component
◦ Min — 0
◦ Max — 0.6
 | Concentration CH4 [-] 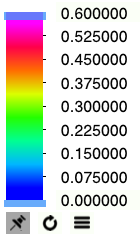 |
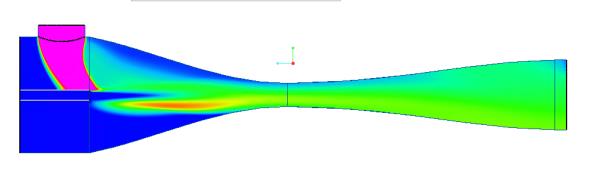
4. In the Properties panel, View tab, for Surface, set values for the options as listed below:
◦ Grid — No
◦ Outline — No
◦ Variable — Concentration:O2 [-] : Component
◦ Min — 0
◦ Max — 0.1
 | Concentration O2 [-] 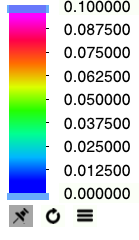 |
5. In the Properties panel, View tab, for Surface, set values for the options as listed below:
◦ Grid — No
◦ Outline — No
◦ Variable — Concentration:H2O [-] : Component
◦ Min — 0
◦ Max — 0.6
 | Concentration H2O [-] |
Viewing the Pressure and Mach Number Contours on Sections
1. Create a sections Section 02. It appears under Derived Surfaces.
2. Select Section 02. In the Properties panel, Model tab, set values for the options as listed below:
◦ Type — Plane Y
◦ Position — 0.055
3. In the Properties panel, View tab, for Surface, set values for the options as listed below:
◦ Grid — No
◦ Outline — No
◦ Variable — Pressure: [Pa] :Flow
◦ Min — 100500
◦ Max — 102000
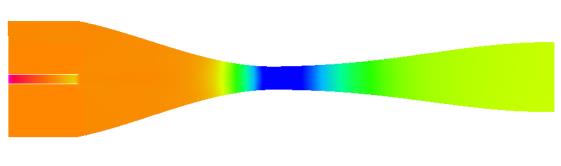 | Pressure Pa  |
4. In the Properties panel, View tab, for Surface, set values for the options as listed below:
◦ Grid — No
◦ Outline — No
◦ Variable — Mach Number: [-] :Flow
◦ Min — 0
◦ Max — 0.15
 | Mach Number [-]  |
Plotting the Temperature at the Outlet Boundary
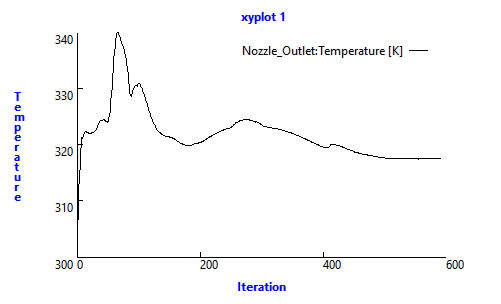
1. In  Boundary Conditions >
  General Boundaries select Nozzle_Outlet.
Boundary Conditions > General Boundaries select Nozzle_Outlet.2. Click  XYPlot. A new entity xyplot1 is added in the Flow Analysis Tree under > .
XYPlot. A new entity xyplot1 is added in the Flow Analysis Tree under > .3. Select xyplot1.
4. In the Properties panel, set the Variable as Temperature.