PTC Customer Detail Reports Using Pivot Tables
The PTC Customer Detail Report provides a excellent means for system administrators to monitor and manage their PTC Licenses. This report generates a snapshot of a customer's installation including product, hardware, address, and maintenance status for each product entry in PTC's database. In working with License Management, system admins can use the report to communicate configuration changes and the re-allocation of licenses. The following document explains the Microsoft Excel Pivot Table functionality which allows you to easily sort and view the data however you need to review the report information.
Use the Example Data in the file example.xls to create a Pivot Table.
Creating Excel Pivot Tables:
1. Open the example Customer Detail Report in Excel - example.xls.
2. Highlight the set of data to be reviewed through the pivot table.
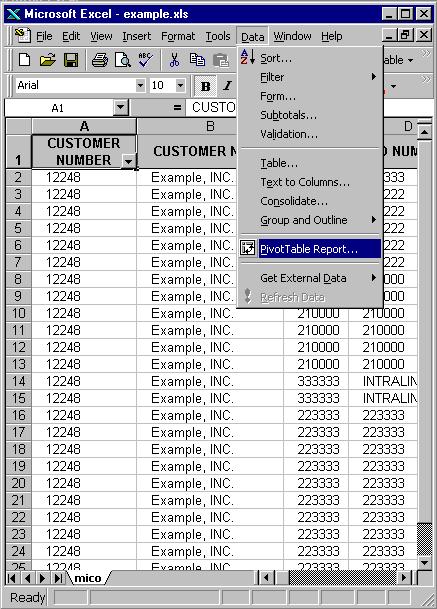
3. Select the menu options - Data - PivotTable Report... as shown in Table 1 below.
- To select the data, simply select one of the cells within the report information. Selecting Cell A1 in Table 1 below would be enough.
Table 1
4. Select - Next in the PivotTable Wizard - Step 1 of 4 screen to accept the default Microsoft Excel list or database option.
5. Select - Next in the PivotTable Wizard - Step 2 of 4 screen to accept the Range information for the Pivot Table.
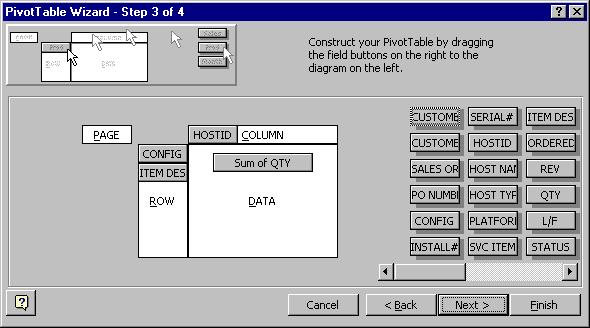
6. Define the contents of the Pivot Table in the PivotTable Wizard - Step 3 of 4 * For Windows 2000 Select layout and it will bring you to the picture below.
- Drag and drop the data column heading icons from the right as shown below. These icons represent all of the highlighted columns from the Customer Detail Report.
- Place
- This example will create a table to display the license information assigned to each machine.
- Place the Host Id icon in either the COLUMN or ROW area.
- Drag the Config Id icon into the ROW area.
- Move the Item Description icon into the ROW area.
- Drop the QTY (quantity) icon into the DATA area.
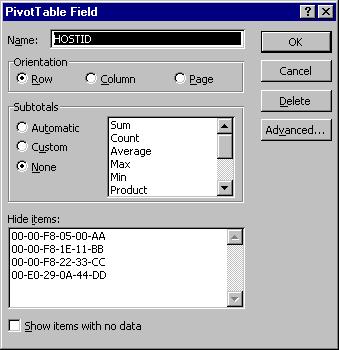
Notes:The format of the Table can be adjusted by setting various options for the row, colum or data selections. Simply Double-click on the desired icon to change the available options.
Row and Colum Options:
- Sub Totals for each Row or Column item can be removed by setting the Subtotals option to None as shown below.
- Specific items can be omitted from the table by highlighting them in the Hide Items list.
Data Options:Set the data collection process by defining the Summarize by option. The typical use for the Customer Detail Report is to Sum the quantity of licenses. Control the format of the quantity field and set the appropriate decimal places by selecting Number and setting the desired Cell format. For best results with the Customer Detail Report, set the Cell Format to Number and the Decimal Places to zero "0".

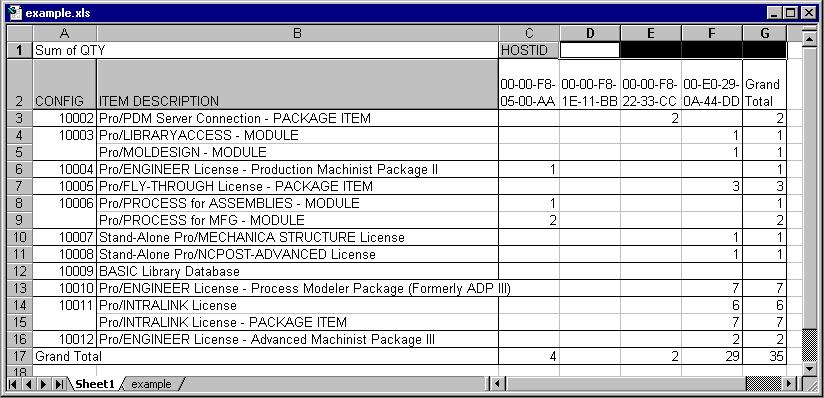
7. By default the Pivot table will be generated on a new Worksheet,
select Finish to create the table. A table as displayed below will
be created.
8. To modify the Table, return to the PivotTable Wizard to make any desired changes. Enter the Wizard through one of two options after selecting on a cell in the pivot table:
- Select the menu options - Data - PivotTable Report... again.
- Select the pivot table cell with the right mouse button and then Wizard...