WWGM – Session Counts
Description
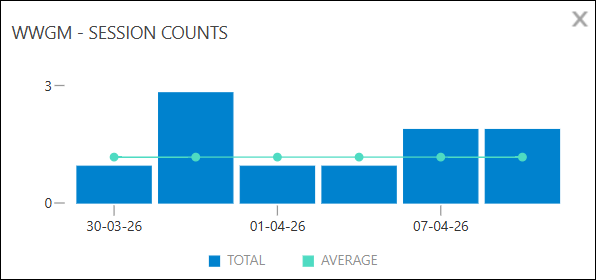
The WWGM – SESSION COUNTS gadget displays a bar graph depicting the total number of sessions per day, with a line plot overlay showing the average number of sessions over the last 7 days. By comparing the average session count to the count for a particular day, you can detect outliers that may indicate heavy usage or potential problems. For example, an above-average session count on a day may be the result of repetitive, reproducible, and unexpected exits. The causes of reproducible exits can usually be diagnosed and resolved.