|
|
Data must be bound to the Bar Chart.
|
|
|
Data must be bound to the Bar Chart.
|
|
Property
|
Description
|
|
Chart Options
|
Click the edit icon next to Chart Options to access the Show Grid Lines for X-axis setting.
|
|
Service
|
JavaScript
|
Description
|
|
Update Chart
|
updateChart
|
Updates the chart.
|
|
Minimum Steps Required for Use
|
What It Looks Like
|
|
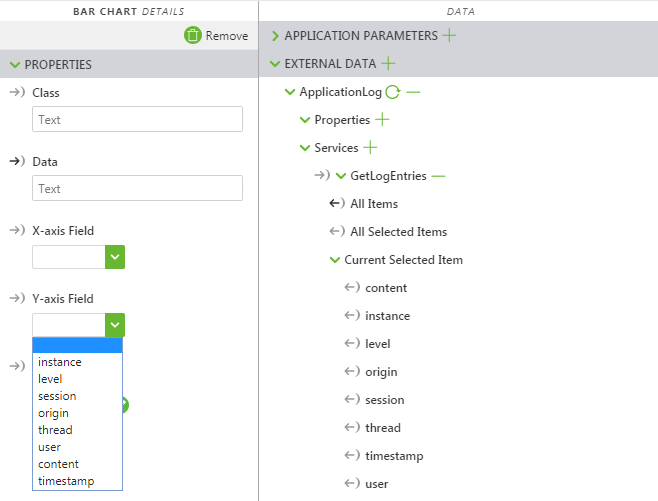
1. Drag and drop a Bar Chart widget onto the canvas.
2. From the Data pane, search for an entity that has a service with a numeric property in the data set.
3. Once the service has been added, drag and drop All Items onto the widget and select Data on the Select Binding Target window.
4. In the Data pane, under Configuration, select the Invoke On Startup checkbox.
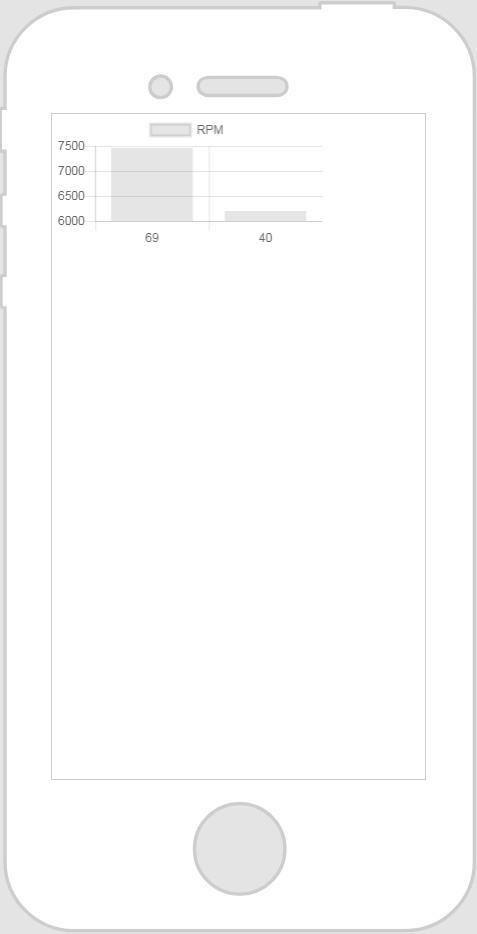
5. Select a property from the X-axis Field drop-down. In the example, we selected Speed.
6. Select a property from the Y-axis Field drop-down. In the example, we selected RPM.
|
 |
|
|
Keep in mind that it’s best to give your classes unique names so they do not conflict with other classes or OOTB properties.
|
|
Example
|
What It Looks Like
|
|
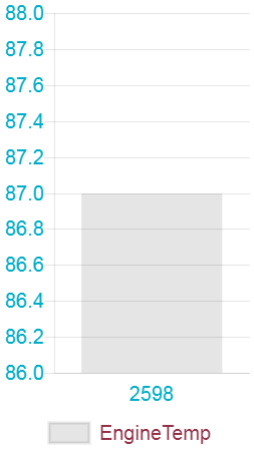
1. Enter the following in the JavaScript editor:
Chart.defaults.global.legend.position="bottom";
Chart.defaults.global.legend.labels.fontColor="#912f46"; Chart.defaults.global.defaultFontColor="#00acc8"; Chart.defaults.global.defaultFontSize=20; Chart.defaults.global.title.display=true; 2. Add the following class in the Application editor:
.ptc-barchart {
height: 500px; } 3. Enter the new class in the Class field of the bar chart.
|
 |