Range Chart Widget
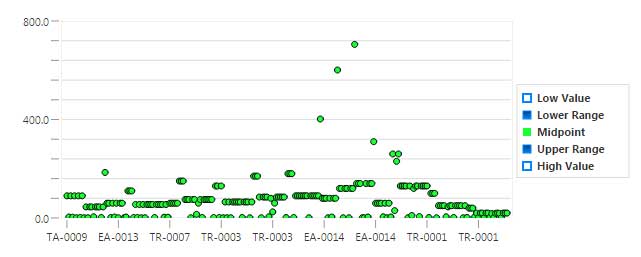
The Range chart shows the data range for a specific x-axis point. You can show markers for up to four points within the range (low value, lower range value, high value, upper range value). This type of chart is sometimes referred to as a Candle chart or a Box & Whisker chart.
The LowValueField and HighValueField define the total range of a row, or data set (the outside of the whiskers), while the LowValueRangeField and HighValueRangeField define the box limit values. To create a chart that is a min-max-median chart, you can bind the median value into the LowValueRangeField and HighValueRangeField, and the box collapses to a marker.
Properties
For information about common widget properties, see Widgets. Properties that are specific to the Range Chart widget are described in the table below.
|
Property Name
|
Description
|
Base Type
|
Default Value
|
Bindable? (Y/N)
|
Localizable? (Y/N)
|
|---|---|---|---|---|---|
|
CustomClass
|
User defined CSS class to apply to the top div of the widget. Multiple classes can be entered, separated by a space.
|
STRING
|
n/a
|
Y
|
N
|
|
Data
|
Data source for the chart values.
|
INFOTABLE
|
n/a
|
Y
|
N
|
|
LowValueField
|
Low value field name.
|
FIELDNAME
|
n/a
|
Y
|
N
|
|
LowerRangeValue
|
Lower range value field name.
|
FIELDNAME
|
n/a
|
Y
|
N
|
|
MidpointField
|
Middle value field name.
|
FIELDNAME
|
n/a
|
Y
|
N
|
|
UpperRangeValue
|
Upper range value field name.
|
FIELDNAME
|
n/a
|
Y
|
N
|
|
HighValueField
|
High value field name.
|
FIELDNAME
|
n/a
|
Y
|
N
|
|
ChartTitle
|
The title of the chart.
|
STRING
|
n/a
|
Y
|
Y
|
|
ShowLegend
|
Display or hide the chart legend.
|
BOOLEAN
|
True
|
N
|
N
|
|
LegendWidth
|
Fixed length of the legend widget.
|
NUMBER
|
0
|
N
|
N
|
|
LegendLocation
|
Location of the legend (Right, Left, Top, or Bottom).
|
STRING
|
Right
|
N
|
N
|
|
LegendOrientation
|
Orientation of the legend (vertical or Horizontal).
|
STRING
|
Vertical
|
N
|
N
|
|
MarkerSize
|
Desired marker size.
|
NUMBER
|
3
|
N
|
N
|
|
MarkerType
|
Desired marker type (Circle, Square, Triangle, Diamond, or Image.)
|
STRING
|
Circle
|
N
|
N
|
|
XAxisField
|
Data source for the field that will provide the x-axis values.
|
FIELDNAME
|
n/a
|
Y
|
N
|
|
ShowXAxis
|
Display or hide the x-axis.
|
BOOLEAN
|
True
|
N
|
N
|
|
XAxisFormat
|
Formatting of the X-Axis labels
|
STRING
|
0000.0
|
N
|
N
|
|
XAxisLabelType
|
Label type of the X-Axis labels
|
STRING
|
String
|
N
|
N
|
|
XAxisLabelRotation
|
Rotation of the X-Axis labels
|
NUMBER
|
0
|
N
|
N
|
|
ShowXAxisLabels
|
Show X-Axis labels
|
BOOLEAN
|
true
|
N
|
N
|
|
ShowXAxisTicks
|
Shows or hides X-Axis tick marks
|
BOOLEAN
|
true
|
N
|
N
|
|
ShowYAxis
|
Shows or hides the Y-axis
|
BOOLEAN
|
True
|
N
|
N
|
|
YAxisFormat
|
Format for Y-axis values
|
STRING
|
0000.0
|
N
|
N
|
|
YAxisMinimum
|
Minimum range for the Y-axis
|
NUMBER
|
0
|
Y
|
N
|
|
YAxisMaximum
|
Maximum range for the Y-axis
|
NUMBER
|
100
|
Y
|
N
|
|
YAxisAutoscale
|
Automatically scales the Y-axis
|
BOOLEAN
|
True
|
N
|
N
|
|
YAxisZeroscale
|
Forces a zero minimum when automatically scaling the Y-axis
|
BOOLEAN
|
False
|
N
|
N
|
|
YAxisIntervals
|
Number of Y-axis chart intervals for large ticksAffects ticks and grids
|
NUMBER
|
10
|
N
|
N
|
|
YAxisMinorTicks
|
Number of Y-axis minor ticks between intervals
|
NUMBER
|
1
|
N
|
N
|
|
YAxisLabels
|
Number of intervals for a Y-axis label
|
NUMBER
|
2
|
N
|
N
|
|
ShowYAxisLabels
|
Shows or hides Y-axis labels
|
BOOLEAN
|
True
|
N
|
N
|
|
ShowYAxisTicks
|
Shows or hides Y-axis tick marks
|
BOOLEAN
|
True
|
N
|
N
|
|
AllowYAxisZoom
|
Allows zooming on the Y-axis
|
BOOLEAN
|
True
|
N
|
N
|
|
AllowSelection
|
Allows item selection
|
BOOLEAN
|
True
|
N
|
N
|
|
EnableHover
|
Displays values when hovering over
|
BOOLEAN
|
True
|
N
|
N
|
|
ShowXAxisGrid
|
Shows the horizontal grid
|
BOOLEAN
|
True
|
N
|
N
|
|
ShowYAxisGrid
|
Shows the vertical grid
|
BOOLEAN
|
True
|
N
|
N
|
Events
DoubleClicked
DoubleClicked allows you to have a single-click select on the data object but still use a double click for another event, such as linking a double click to trigger a navigation link.