System Profile Page
Click the title on the SYSTEM DETAILS gadget or select System Profile from the Go to page list on the dashboard to open the System Profile page. The drill down pages show data from the Servigistics GUID selected on the main dashboard. However, you can switch to a different Servigistics Server by selecting a different GUID on the drill down pages.
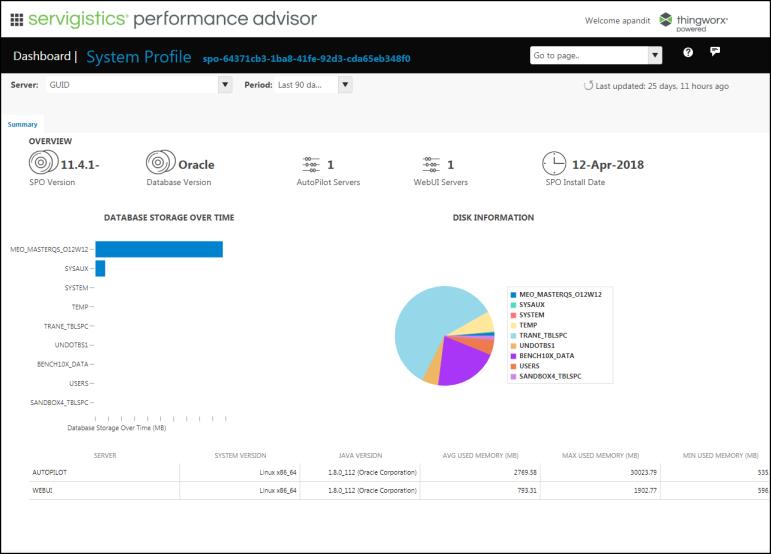
The Overview section provides detailed information about the Servigistics system usage for the past 90 days. You can change the period from the Period drop-down list to view the system usage for the past 180 days, 270 days or 360 days.
The Overview section lists the following details:
• SPO Version: The SPO version for the specified GUID
• Database Version: The database version
• AutoPilot Servers: The number of autopilot servers that are active
• Web UI Servers: The number of Web UI servers that are active
• SPO Install Date: The date on which the SPO was installed
DATABASE STORAGE OVER TIME: This section contains a bar diagram that shows the database tablespaces storage over the specified period.
DISK INFORMATION: This section contains a pie chart that shows the disk space currently occupied by different database tablespaces.
The System Profile table lists the following information:
• SERVER: The server name. This can be either an AutoPilot or a WebUI server.
• SYSTEM VERSION: The system version
• JAVA VERSION: The java version
• AVG USED MEMORY (MB): The average memory used by the server process
• MAX USED MEMORY (MB): The maximum memory used by the server process
• MIN USED MEMORY (MB): The minimum memory used by the server process