Page Usage Page
Click the title on the PAGE USAGE gadget or select Page Usage from the Go to page list on the dashboard to open the Page Usage page. The drill down pages show data from the Servigistics GUID selected on the main dashboard. However, you can switch to a different Servigistics Server by selecting a different GUID on the drill down pages.
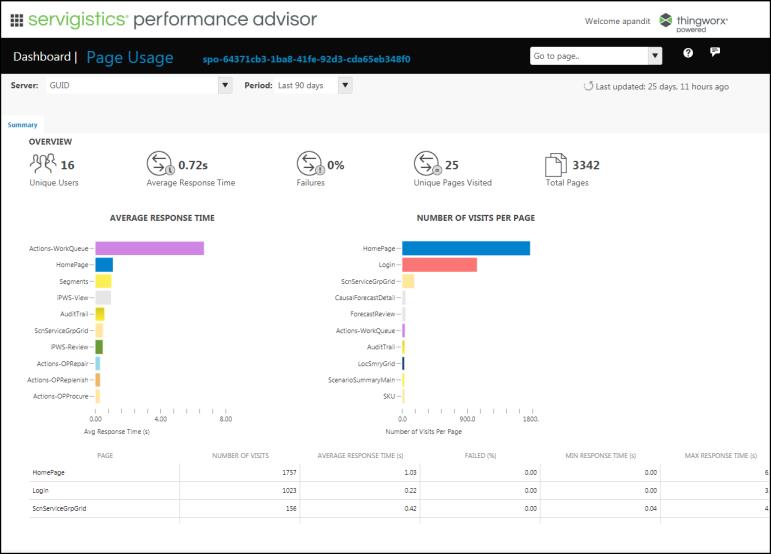
The Overview section provides detailed information about the Servigistics page usage for the past 90 days. You can change the period from the Period drop-down list to view the page usage for the past 180 days, 270 days or 360 days.
The Overview section lists the following details:
• Unique Users: The number of unique users that visited any of the pages
• Average Response Time: The cumulative average response time of all the pages
• Failures: The number of pages that failed to load
• Unique Pages Visited: The number of unique pages visited by all the users
• Total Pages: The total pages visited by all the users
AVERAGE RESPONSE TIME: This section contains a bar diagram that shows the average response time of the pages.
NUMBER OF VISITS PER PAGE: This section contains a bar diagram that shows the number of visits per page.
The Page Usage table lists the following details:
• PAGE: The name of the Servigistics page
• NUMBER OF VISITS: The number of visits to a page
• AVERAGE RESPONSE TIME (s): The average response time of a page
• FAILED (%): The number of times a page failed to load
• MIN RESPONSE TIME (s): The minimum response time of a page.
• MAX RESPONSE TIME (s): The maximum response time of a page