Planning Data Usage Page
Click the title on the PLANNING DATA gadget or select Planning Data Usage from the Go to page list on the dashboard to open the Planning Data Usage page. The drill down pages show data from the Servigistics GUID selected on the main dashboard. However, you can switch to a different Servigistics Server by selecting a different GUID on the drill down pages.
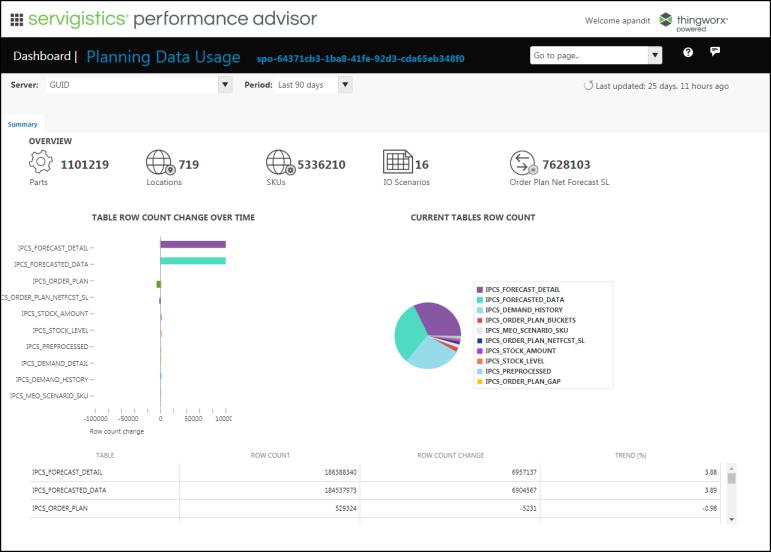
The Overview section provides detailed information about the Servigistics data usage for the past 90 days. You can change the period from the Period drop-down list to view the data usage for the past 180 days, 270 days or 360 days. The Overview section lists the following details:
• Parts: The number of parts available
• Locations: The locations where parts are available
• SKUs: The number of SKUs
• IO Scenarios: The number of Inventory Optimization Scenarios
• Order Plan Net Forecast SL: The number of records in the IPCS_ORDER_PLAN_NETFCST_SL table
TABLE ROW COUNT CHANGE OVER TIME: This section contains a bar diagram that shows the table row count change over the specified period.
CURRENT TABLES ROW COUNT: This section contains a pie chart that shows the current tables row count.
The Data Usage table lists the following information:
• TABLE: The name of the database table
• ROW COUNT: The current row count of the database table
• TREND: The cumulative change in the row count of the database table over the specified period