AutoPilot Usage Page
Click the title on the AUTOPILOT PROCESS EXECUTIONS gadget or select AutoPilot Usage from the Go to page list on the dashboard to open the AutoPilot Usage page. The drill down pages show data from the Servigistics GUID selected on the main dashboard. However, you can switch to a different Servigistics Server by selecting a different GUID on the drill down pages.
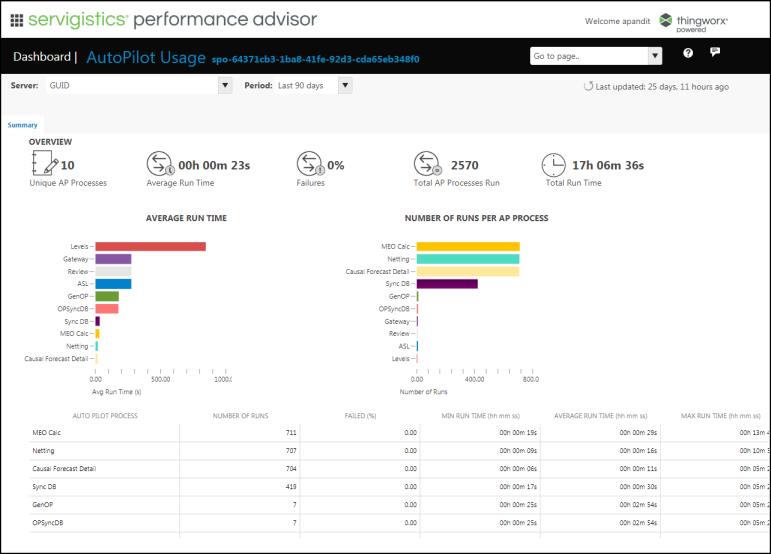
The Overview section provides detailed information about the Servigistics autopilot usage for the past 90 days. You can change the period from the Period drop-down list to view the autopilot usage for the past 180 days, 270 days or 360 days.
The Overview section lists the following details:
• Unique AP Processes: The number of unique AP processes that are run expressed in percentage
• Average Run Time: The average time taken to run the processes
• Failures: The number of times the processes failed to run
• Total AP Processes Run: The total number of AP processes run
• Total Run Time: The total run time of the processes
AVERAGE RUN TIME: This section contains a bar diagram that shows the average time taken to run the processes.
NUMBER OF RUNS PER AP PROCESS: This section contains a bar diagram that shows the number of runs per AP process.
The Autopilot Usage table lists the following information:
• AUTO PILOT PROCESS: The name of the autopilot process
• NUMBER OF RUNS: The number of times the autopilot process was run
• FAILED (%): The number of times the autopilot process failed to run expressed in percentage
• MIN RUN TIME: The minimum run time of the autopilot process expressed in hours, minutes, and seconds
• AVERAGE RUN TIME: The average run time of the autopilot process expressed in hours, minutes, and seconds
• MAX RUN TIME: The maximum run time of the autopilot process expressed in hours, minutes, and seconds